Dr. John Mabry
This article is from the 2015 PigCHAMP Benchmark Magazine.
To find the online edition of the magazine Click Here
This article is simply an overview of the last ten years of benchmarking data from the Pigchamp.com database of reproductive trait performance. Over a ten year period there is some change to be expected in the reproductive performance of swine herds in the USA. But just how much change is expected, and what has been seen in the data?
The data examined here consists of yearly averages (2004-2013) for the primary reproductive traits measured by producers using the Pigchamp sow management system software. These are yearly averages, so short term influences won’t be strongly evident. And the yearly averages are presented across all herds submitting data, and those in the top 10% and bottom 10%. My discussion will focus more on the yearly averages.
Readers should also realize that some of the traits examined are measures of reproductive performance (like farrowing rate), others are management decisions (like piglet age at weaning), and some are a bit of both (like repeat services). As a result we should consider all the potential reasons for variables to change over time as we analyze what has happened and what factors possibly caused these traits to change.
To start with, we fully expect there to be changes in these reproductive performance traits over time. The goal of most producers is to make improvement in these traits over time, and this improvement can be driven by a number of factors, as listed below:
a) Genetic improvement by the genetic supplier: Each pork producer must get their replacement genetics from a genetic supplier, and each genetic supplier is making good faith efforts to improve the genetic merit of their product. In terms of reproduction, most genetic suppliers have focused primarily on improving litter size over the past ten years, and have made significant progress. Other reproductive traits that have been targets for genetic improvement include decreasing mortality in both the sows and piglets, decreasing wean to service interval, and increasing milking ability of the sow. Maternal lines have also seen significant improvements in growth rate, leanness and percent lean over the past ten years. But in so doing, both sow and piglet mortality has increased significantly in the pure line maternal populations.
“We fully expect there to be changes in these reproductive performance traits over time. The goal of most producers is to make improvement in these traits over time, and this improvement can be driven by a number of factors”
b) Animal health challenges. Over the past ten years we have certainly seen various herd health challenges. But most have been chronic over time, with perhaps more losses due to challenges like PRRS seen in the later years than the early years. The dataset used for this article ended with 2013 data, a timeframe that predates the more severe impacts of the PED virus.
c) Normal aging of facilities: Over time, the facilities used for pig production will gradually degrade in the quality of environment that can be provided for the piglet. However, this should be a minor effect as we are looking only at a ten year time frame, and some new facilities will enter the data system as well.
d) Poorer performing farms exiting farrowing: Over a ten year time frame, there will be some production units that are not making an adequate profit to continue, and will most likely be performing at a below average level. However, this should be a small number of farms exiting.
e) Industry wide management changes: Over the past ten years we have seen some industry wide reproductive management changes, most of which should not have a negative effect on performance. This includes an increase in the use AI, and a trend towards group housing of sows during gestation.
f) Shorter term non-genetic factors: yearly economics like corn price extremes, market price extremes, and unusually high heat stress in summer have the potential to exert an impact on the reproductive performance.
g) Management quality: over the past ten years, the ability of our animal caretakers to exert a more positive influence on animal comfort and performance has likely improved. While not a major influence, is should be a positive one.
FARROWING RATE AND % REPEAT SERVICES:
Over the past ten years we have seen farrowing rate increase from 77.7% to 84.9% on average (Chart 1). This +7% increase seems to be a steady improvement with only one year where farrowing rate regressed. This improvement is probably due to nongenetic factors, since this is not a trait in most seedstock company’s genetic improvement program. Perhaps this is due to better reproductive management, including better semen quality, better AI technique, and better replacement gilt management programs over the past ten years. The improvement seen in both the top and bottom 10% closely mirror that seen across all the herds.
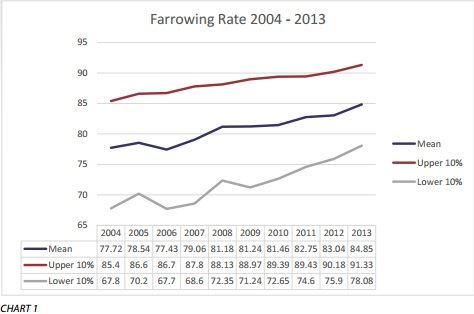
But the improvement seen in the lower 10% is more variable, suggesting less control over this management influenced trait that others. It is interesting that while farrowing rate has increased, litters/ sow/year (a closely related trait) does not appear to have seen a similar increase.
“It is interesting that while farrowing rate has increased, litters/sow/year (a closely related trait) does not appear to have seen a similar increase.”
Repeat services has seen a gradual decline over the past ten years, where the reduction in repeat service % is very close to the improvement seen in farrowing rate (6% vs 7%). There did appear to be a greater drop in repeat services in 2008 (seen in overall average and Upper 10%). This is perhaps due to 2008 being the first year where producers saw the price of corn increase dramatically (from $3.39 to $4.85 per bushel). With this sudden increase many producers did not give as many sows a second chance or repeat service.
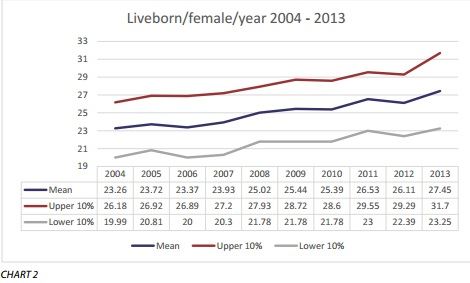
LITTER SIZE: There are several measures of litter size to consider: total born, stillborn, mummies, liveborn, liveborn/sow/year (Chart 2). Since this has been a major success in genetic improvement, significant improvement is expected in these traits. Both total born and live born have increased by 0.185 pigs/litter/year. This is slightly more than the average genetic improvement in breeding companies and suggests some non-genetic improvement also. It appears that the bottom 10% of producers for litter size in 2013 has just now reached the performance of the top 10% producers in 2004, about 10 years behind. The factors that increased farrowing rate should have had a similar positive effect on litter size. These increases in litter size have been accompanied by non-significant changes in stillborn and mummies per litter. However, as litter sizes have increased this will potentially create challenges for other reproductive traits. If the litter size in the sow exceeds her uterine capacity, then pig birth weight will decrease. This problem will exert its negative effect in pigs with birth weight below 1 kg (2.2 lbs) that have a resultant higher piglet mortality, and if they survive to weaning, have a much lower chance to make a profit when finished in our current weanfinish facilities. The increase in liveborn/ female/year is the same percentage as the increase in liveborn, suggesting that litters/sow/year has stayed constant over our time frame.
LITTER WEANING TRAITS: As litter size increases there is the probability that pre-weaning mortality will increase also. The data shows a small increase in pre-weaning mortality over the past ten years. This increase of 0.91% over the ten year period is much lower than the +18% liveborn pig increase. An increase in lactation length could also be a small factor in the increase in baby pig mortality, as the age at weaning has increased 2+ days over the past ten years. The driving factor here is probably producers that have moved to wean-finish barns where pigs’ performance is more sensitive to weaning weight. However, I would suspect most of this increase in piglet mortality will be found in the number of pigs with birth weights under 1 kilogram. With the increase in litter size greater than the increase in piglet mortality, the number of pigs weaned per litter would be expected to increase, and it has greatly over the past ten years.
However, the pigs/weaned/litter does appear a bit larger than expected. The increase in pigs weaned/sow/year is similar to the increase in pigs weaned/ litter, suggesting that litters/sow/year has not changed significantly over the past ten years.
“The past ten years has shown significant improvements in most reproductive traits, most noticeably in farrowing rate and litter size.”
SOW REMOVAL TRAITS: Sows generally exit the herd either on a voluntary basis (% culled/year) on an involuntary basis (% sow deaths/year). Reasons for sow culling are almost always related to having a litter or not (failure to conceive, failure to farrow, failure to recycle). This usually is much larger than the sow mortality rate, and that is the case here. The percent of sows culled per year was generally in the mid-40% range over most years. However, in 2005 and 2006 this culling rate was higher than other years. These two years were also very high profit years, so perhaps producers felt they could justifying culling marginal sows since their profits were high. In the late 2000’s data was publicized that showed the cost of voluntary culling sows was much more than the reproductive trait component. This research showed that market hogs from first parity sows made significantly less profit than market hogs from more mature sows. As a result, many in the industry were more hesitant to voluntarily cull marginal sows, resulting in a steady culling % for the latter years of the ten year period examined here. Sow mortality rates have increased slightly over the past ten years. This is likely a function of our success in making sows have larger litters while being leaner. Selection towards these extremes most likely reduces fitness, with an expected slight increase in sow mortality rate.
SUMMARY: The past ten years has shown significant improvements in most reproductive traits, most noticeably in farrowing rate and litter size. While the increase in litter size is primarily due to the success of our seedstock suppliers emphasis on BLUP based selection for litter size, the increase in farrowing rate is more likely due to better reproductive management by our pork producers. This would include details like more robust gilt development protocols, better semen quality, better trained farm inseminators, and, facility improvements. For the future, the increases expected in both farrowing rate and litter size will not be as strong as in the past. We have seen farrowing rate increase from 77% to 85%, and while the opportunity to increase on up to 95% exists, the difficulty in making each percent of improvement get harder as the farrowing rate gets higher. However, genetic suppliers have not been able to improve farrowing rate genetically, if this can be resolved, increasing farrowing rate above 90% becomes more likely.
Also, we can certainly increase litter size beyond 13 total born, but just how far can we do this without having large negative correlated effects. As litter size exceeds uterine capacity the number of pigs with low birth weights increases. If we focus on the number of pigs weaned that have an adequate weaning weight to be profitable (at our weaning ages), then we may in fact pursue an ‘optimal’ level of litter size rather than a ‘maximal’ level of litter size for the future.
Finally, the areas that seem to offer much opportunity for economic gain involve sow removal. If producers can lower the voluntary sow cull rate, and lower sow death rate, a significant improvement in profit would be realized. And from a social standpoint, the lowering of both sow and piglet mortality should logically be a priority for all seedstock suppliers and pork producers.
Source: PigChamp