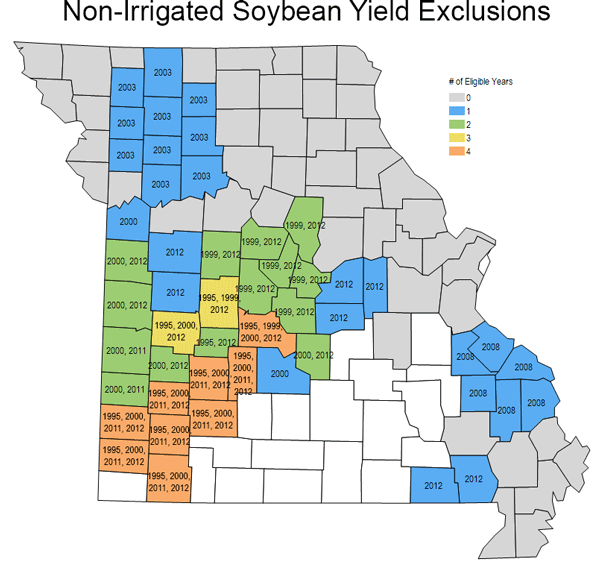
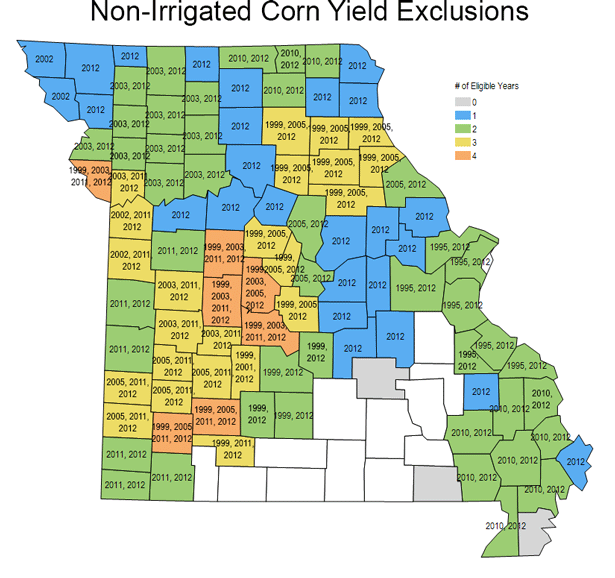
The 2014 Farm Bill included a provision of yield exclusion in the calculation of Actual Production History (APH) used in crop insurance decisions. Yield Exclusion (YE) allows producers, at their discretion, to drop certain years’ production from the APH calculation.
Counties whose yield for a year was below 50% of the average of the previous 10-year county yields are eligible for YE. Also eligible are counties contiguous to these counties. The maps below show which years in each county are eligible for the corn and soybean YE provision, as determined by the USDA Risk Management Agency. More maps for other non-irrigated and irrigated crops can be found at http://crops.missouri.edu/insurance/APHexclusion.htm.


The table below shows an example of the effect of YE, assuming both actual APH and trend adjusted APH. The example is for Audrain county, Missouri where the RMA has determined that years 2005 and 2012 are eligible for yield exclusion for non-irrigated corn. The normal APH for this farmer would be 115 bushels/acre. If YE is taken, the APH rises to 132.6 bushels/acre. If trend adjusted APH is used, the guarantee goes from 123.3 bushels/acre to 140.6 bushels/acre. Either way, the YE provision allows this farmer to increase APH at least 17 bushels/acre.
Electing YE does not change the total premium for the same dollar or yield guarantee. Using YE could allow a producer to choose a lower coverage level (percent of yield or revenue protected) while maintaining the same dollar or yield guarantee. However, federal subsidies are higher for lower coverage levels, so the premium might decrease for the same dollar or yield guarantee.
This note is primarily to alert you to talk with your insurance agent about the YE options available to you as you consider 2015 crop insurance decisions. New options exist. Discuss them with your agent.
| | Actual Yield | Trend Adjusted-APH Yield |
| | without YE | with YE | without YE | with YE |
Year | bu/ac | bu/ac | bu/ac | |
2005 | 56 | | 71.1 | |
2006 | 134 | 134 | 147.6 | 147.6 |
2007 | 123 | 123 | 135.1 | 135.1 |
2008 | 144 | 144 | 154.6 | 154.6 |
2009 | 145 | 145 | 154.1 | 154.1 |
2010 | 122 | 122 | 129.6 | 129.6 |
2011 | 105 | 105 | 111.0 | 111.0 |
2012 | 33 | | 37.5 | |
2013 | 124 | 124 | 127.0 | 127.0 |
2014 | 164 | 164 | 165.5 | 165.5 |
APH Yield | 115 | 132.6 | | |
Trend Adjusted APH | | | 123.3 | 140.6 |
Source:missouri.edu