By Todd Hubbs, Scott Irwin, and Darrel Good
Department of Agricultural and Consumer Economics
University of Illinois
We recently began a series of articles to evaluate the history of corn and soybean yields and deviations from trend yield in Brazil and Argentina. The objective of the yield analysis is to provide a basis for forming expectations about the likely yields of the 2017 crops. The first five articles focused on the alternative sources of historical yield estimates, the selection of the appropriate series to use in the analysis for both corn and soybeans, the selection of the best-fitting trend model for each commodity and country, and trend yield deviations in each country for corn (farmdoc daily, November 2, 2016; November 9, 2016; November 16, 2016; December 14, 2016; and December 15, 2016). Today's article examines soybean yield trend estimates and trend deviations for the Brazilian soybean crop. Brazil is the world's second largest producer of soybeans and is a major competitor with the United States in the world soybean market. Table 1 presents soybean production by country from 1970 through 2015 and gives an indication of overall growth in soybean production in the world, and Brazil in particular.

Background
We begin by providing some perspective on regional soybean production concentration in Brazil. The production map of Brazil from the USDA/FAS gives a visual sense of the concentration. Table 2 shows the Brazilian states by region. Figure 1 shows the changing nature of Brazilian soybean planted acreage within the country using estimates from CONAB, The National Food and Supply Company (a public company allied with the Brazilian Ministry of Agriculture, Livestock, and Supply). The area and yield estimating methodology used by this organization is very different than used by NASS to make yield estimates for the U.S. To the best of our knowledge, CONAB uses satellite data, information from field operators, and various statistical methodologies to derive area and yield estimates. The explosive growth in soybean acreage in the Central West region is obvious over the sample period. Central West and South region production dominate soybean acreage currently with increased planting in the Southeast region over the last five years. Brazil continues to plant more acreage in soybeans with a steady upward trend in planted acreage over the last decade.
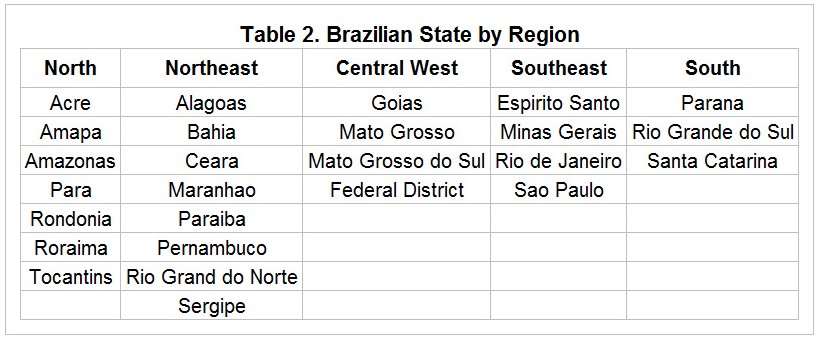
Figure 2 presents the annual soybean yields in Brazil for the period 1978 through 2016. As previously discussed in the farmdoc daily article of November 16, 2016, we chose a linear trend to fit the soybean yield data for Brazil. Note that these yield estimates are provided by the USDA's Foreign Agricultural Service (FAS) and are based on past trends, expert opinion, industry intelligence, and CONAB estimates. Yields have obviously trended higher over time. The linear trend indicates annual average yield increases 0.66 bushels for Brazil. A linear trend explains about 89 percent of the annual variation in actual yields in Brazil. The historical soybean yields in Brazil show quite a bit of variation around the trend with a noticeable exception from 1992-1997, when yields were consistently near trend values.
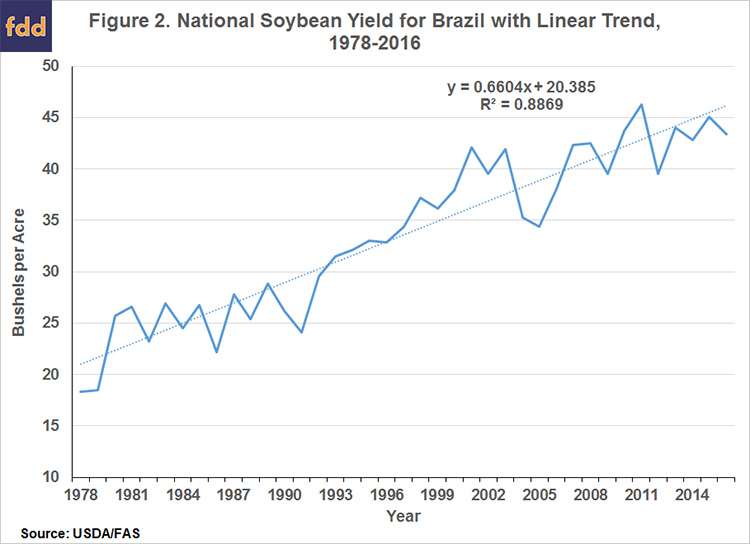
The period of yields consistently near trend value in the mid-1990's represents a very different pattern than experiences over other time periods. Estimated yields were very near trend value in both the traditional production regions and in the rapidly expanding Central West region, with offsetting yield deviation in these regions. While the pattern is unusual, there is no obvious explanation beyond the likelihood of a period of favorable weather. However, these yield estimates may also reveal some estimating methodology deficiencies in the non-probabilistic yield estimates for Brazil.
Since soybean production increased rapidly in the Central West region during the sample period, we examine trend yields separately for the Central West region and all other regions. Regional soybean yields for Brazil without the Central West region are calculated using a weighted average of planted acres and production for each region using CONAB estimates. The Central West region soybean yield data is truncated to 1983 due to low acreage levels prior to that year. A linear trend is the basis for subsequent trend deviation analysis for both sets of data.
In Figure 3, the linear trend for all Brazilian regions without the Central West region indicates that the annual average yield increased 0.60 bushels per acre. The linear trend explains approximately 79% of the yield variation in those regions. Variation around the trend is pronounced with the exception of a period of sustained above trend yields between 1992 and 1999. The expected soybean yield for these regions based on the linear trend for 2017 is 43.50 bushels per acre.
Figure 4 displays a different story for Central West region soybean yields. We present a linear and quadratic trend for soybean yields in the region. The quadratic trend provides a better fit over the sample period and highlights the decreasing rate of trend yield growth in the Central West region over the last five years. It is tempting to say a new period of flattening yields has occurred in the region due to a variety of factors that include double cropping management practices and large acreage expansion into new territory. If the yield trend in the region is slowing down and the quadratic fit is the proper relationship, the expected yield for the region in 2017 is 45.57 bushels per acre. We choose to analyze trends and deviation with the linear yield trend due to the unusual pattern of yields in the region. Yields in the Central West region stay on or below its trend until 1997. After 1997, a sustained period above trend yields is maintained until 2003. A pattern of both above trend and below trend yields was maintained over the rest of the sample. It is striking, however, that actual annual soybean yields in the region have been below trend and decreasing since 2012. The expected soybean yield for the Central West region based a linear trend is 48.39 bushels per acre.
Historical Deviations
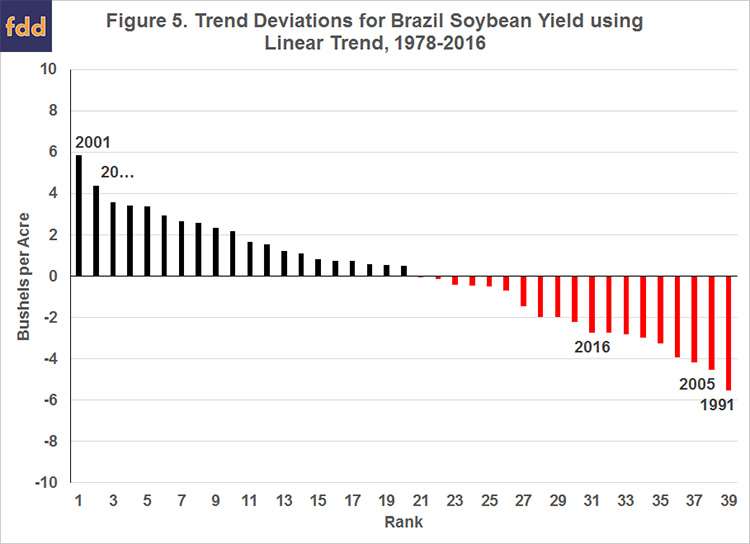
Historical deviations for Brazilian soybean yields for the period 1978 - 2016 are shown in Figure 5. Over the 39-year period, the average Brazilian soybean yield was above trend in 20 years and below trend in 19 years. The largest deviation below trend was 5.54 bushels per acre in 1991. The largest positive deviation from trend was 5.84 bushels per acre in 2001. The average positive deviation was 2.13 bushels while the average negative deviation was -2.25 bushels. The deviation from trend is quite symmetric in count and magnitude. This differs substantially from similar analysis on U.S. soybean trend deviations. Brazilian soybean yields have been below trend and slightly variable since 2012 with significant yield loss in 2014 and 2016. Based on the historical trend deviations, the unconditional probability of a negative deviation is 50 percent. If a negative deviation occurs, the unconditional probability of a negative deviation of greater than two bushels is 53 percent and there is a 16 percent probability of a greater than four-bushel deviation. If a positive deviation occurs, the unconditional probability of a positive deviation of greater than two bushels is 50 percent and there is a 10 percent probability of a greater than four-bushel deviation.
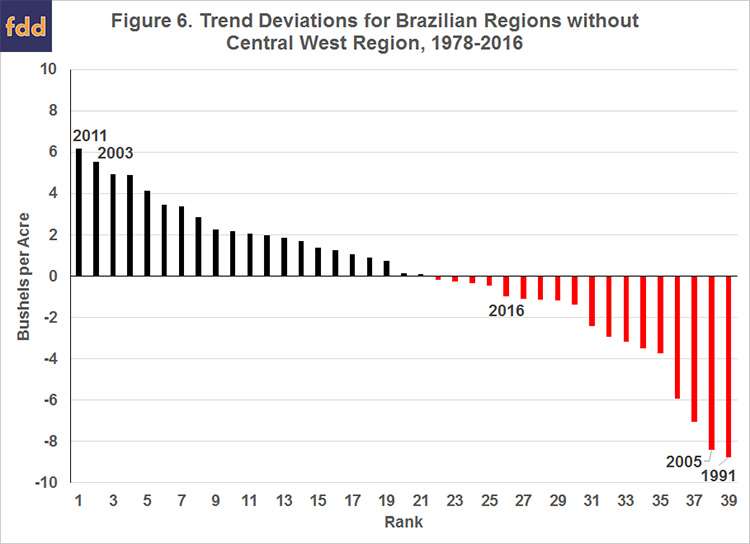
Historical deviations for Brazilian soybean yields in regions other than the Central West Region for the period 1978 - 2016 are shown in Figure 6. Over the 39-year period, the average soybean yield was above trend in 21 years and below trend in 18 years. The largest deviation below trend was 8.76 bushels per acre in 1991. The largest positive deviation from trend was 6.17 bushels per acre in 2011. The average positive deviation was 2.52 bushels while the average negative deviation was -2.94 bushels. The deviation from trend does not have the same symmetry in count and magnitude shown in the national yield deviations. Negative trend deviations tend to be larger in magnitude than positive deviations. Based on the historical trend deviations, the unconditional probability of a negative deviation is 46 percent. If a negative deviation occurs, the unconditional probability of a negative deviation of greater than two bushels is 50 percent and there is a 22 percent probability of a greater than four-bushel deviation. The unconditional probability of a positive yield deviation is 54 percent. If a positive deviation occurs, the unconditional probability of a positive deviation of greater than two bushels is 52 percent and there is a 24 percent probability of a greater than four-bushel deviation. The probability of yield being more than two bushels below (above) trend is 23 (28) percent. The probability of yield being more than four bushels below (above) trend is 10 (13) percent.
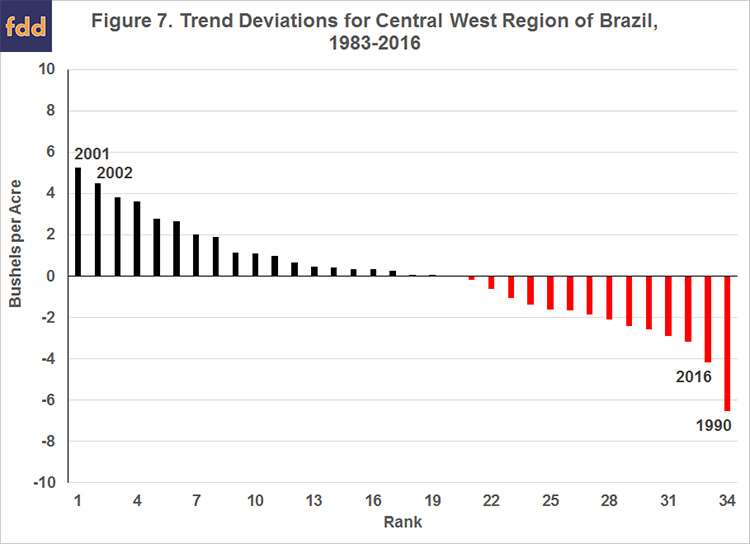
Historical deviations for soybean yields in the Central West Region (based on a linear trend) for the period 1983 - 2016 are shown in Figure 7. Over the 34-year period, the average soybean yield was above trend in 19 years and below for 15 years. The largest deviation below trend was 6.54 bushels per acre in 1990. The largest positive deviation from trend was 5.27 bushels per acre in 2001. The average positive deviation was 1.70 bushels while the average negative deviation was -2.15 bushels. Negative trend deviations tend to be larger in magnitude than positive deviations. Based on the historical trend deviations, the unconditional probability of a negative deviation is 44 percent. If a negative deviation occurs, the unconditional probability of a negative deviation of greater than two bushels is 47 percent and there is a 13 percent probability of a greater than four-bushel deviation. The unconditional probability of a positive yield deviation is 56 percent. If a positive deviation occurs, the unconditional probability of a positive deviation of greater than two bushels is 42 percent and there is a 11 percent probability of a greater than four-bushel deviation. The probability of yield being more than two bushels below (above) trend is 21 (26) percent. The probability of yield being more than four bushels below (above) trend is 6 (6) percent.
Implications
An examination of the national average soybean yields in Brazil for the period 1978 through 2016 reveals an upward yield trend with substantial annual variation. The estimated linear soybean yield trend points to a 2017 average soybean yield of 46.8 bushels per acre, 3.38 bushels above the 2016 average and 0.56 bushels above the record yield of 2011. Based on the projections of harvested acreage in the USDA's January 12 World Agricultural Production report, yields at trend value for Brazil points to a 2017 crop of 3.909 billion bushels, 363 million bushels (10.2 percent) larger than the 2016 crop. Using estimates of the historical yield trend deviations, we estimate there is an unconditional probability of 51 percent of yields above or below trend by two bushels per acre. The largest deviation below trend was 8.76 bushels per acre and the largest positive deviation from trend was 6.17 bushels. A trend yield deviation of two bushels per acre would add or subtract 167 million bushels to our projection of Brazil's 2017 production.
The USDA projects the 2017 Brazilian yield at 45.65 bushels per acre (1.15 bushels below the trend value) and production at 3.821 billion bushels, 276 million bushels larger than the 2016 crop. The USDA estimated production level for Brazilian soybeans is slightly less than our national average projections but very close to the expected production level generated from our regional trend analysis. It appears that 2017 may be a return to soybean trend yield in Brazil. The large growth in soybean acreage in the Central West region and the recent flattening of yields in the region creates uncertainty about the yield risks in Brazil. While the national trend deviations calculated from FAS data are symmetric, the downside potential and flattening of yields over the last few years in the Central West region provides the possibility of lower trend yield growth. It is too early to tell and the next few years will be informative. In the next article, we will examine soybean yield deviations in Argentina to further assess soybean yield and production risk for 2017 in South America. Future articles will assess the impact of La Nina events on Brazilian and Argentinian soybean and corn production.