By Carl Zulauf
Department of Agricultural, Environmental and Development Economics
Ohio State University
The farmdoc daily article of May 25, 2017 explored the substantial economies of size in producing milk and its relevance to U.S. dairy policy. A follow-on question of interest is, "How do economies of size compare for milk and other program commodities, notably field crops?" A recent analysis of economies of size on crop farms (Key) permits one perspective on this question. Economies of size are found to be more pronounced for milk. In particular, per unit cost declines more slowly for larger than smaller crop farms but declines at roughly the same rate across all dairy farm sizes.
Data
Cost of producing milk by herd size is compiled on an ongoing basis by the U.S. Department of Agriculture. No similar data set exist for crops. However, Key recently used data from the 1982 and later Censuses of Agriculture to estimate cost of production for farms located in the U.S. Heartland region (Corn Belt/Midwest - see data note 1) and on for which barley, corn (grain), oats, sorghum (grain), soybeans, and wheat were at least 90% of farm sales and harvested acres. This study compares milk and crop cost of production for 2012, the latest available Census year.
Economies of Size: Dairy
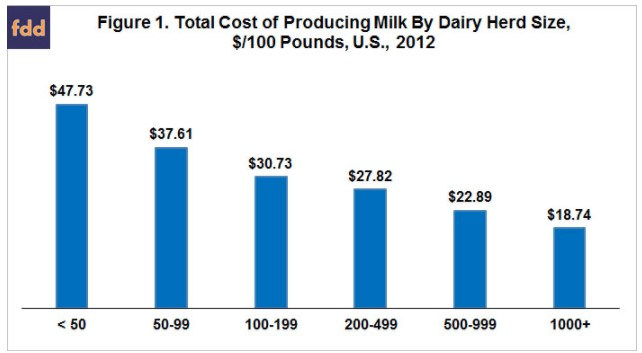
Total cost of producing milk in 2012 declined from $47.73 per hundredweight (cwt.) for herds of less than 50 cows to $18.74/cwt. for herds of 1,000 or more cows (see Figure 1). The rate of decline is highest between the smallest and next smallest herds (-21%). The declines between pairs of increasing dairy farm size are -18%, -9%, -18%, and -18%, respectively. Thus, the rate of decline slows only slightly as size increases. The same pattern was found for 2016 (Zulauf). Components of the cost of producing milk are discussed in data note 2.
Economies of Size: Crops
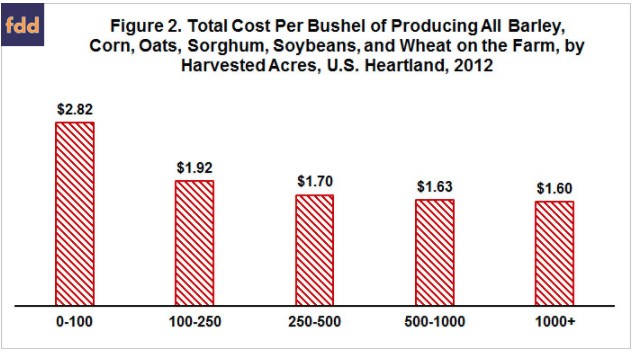
Cost of producing all barley, corn, oats, sorghum, soybeans, and wheat harvested on a farm in 2012 declined from $2.82 per bushel (bu.) for farms with 100 or fewer acres to $1.60/bu. for farms with 1000 or more acres (see Figure 2). Cost declined relatively more for crops than milk between the smallest and next smallest farm sizes (-32% vs. -21%). However, cost of producing crops declined by only -4% and -2% between adjacent pairs of the 3 largest crop farms, much smaller than the comparable -18% declines for milk farms. For comparison purposes, per bushel cost of producing corn in 2010 was found to vary little by farm size as measured by acres planted to corn (Foreman). Components of the cost of producing crops in Key's study are discussed in data note 3.
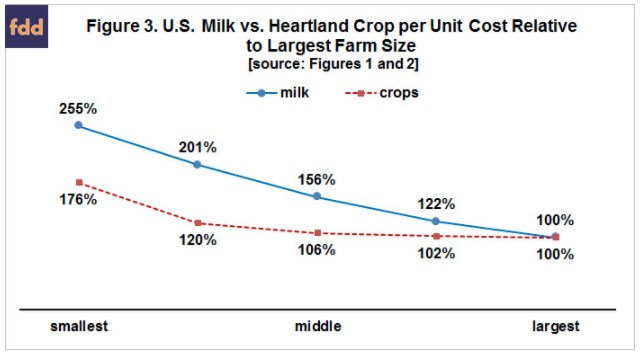
Comparison: Figure 3 contains per unit cost of producing milk and crops for each farm size relative to per unit cost for the largest farms. Note, the two middle size dairy herd categories are averaged so dairy and crop farms both have 5 size categories. The much larger economies of size for milk are clearly illustrated. For example, cost is 22 percentage points higher for the 2nd largest than largest dairy farms. In stark contrast, cost for the 2nd smallest crop farms is only 20 percentage points higher than cost for the largest crop farms.
Summary Observations
- Economies of size depend on the size categories in a data set. Different size categories may generate different economies of size. Thus, caution is in order when interpreting this study.
- This comparative study finds economies of size to be generally more pronounced for U.S. milk than Midwest program field crops, with the difference increasing as size increases.
- This comparative study thus reinforces the conclusions of the May 24, 2017 article that (1) economies of size are important to consider when designing U.S. dairy policy and that (2) its magnitude prompts an important policy issue, "Should U.S. dairy policy vary by farm size?"
Data Notes
- The U.S. Department of Agriculture's farm resource regions are discussed in Heimlich. The Heartland region is centered on Illinois, Iowa, and Indiana; and includes parts of most adjacent states.
- Costs of producing milk are feed (homegrown and purchased), hired labor, taxes, insurance, general farm overhead, other operating costs with the largest categories being fuel-lube-electricity, repairs, veterinary-medicine, and bedding-litter; as well as capital recovery cost of machinery and equipment and opportunity costs for both unpaid labor and land.
- Cost of producing crops are expenses for fertilizers, chemicals, fuel, utilities, seeds, and hired labor reported on Census of Agriculture survey forms. An implied cost of machinery and equipment plus opportunity cost for both land and unpaid labor are estimated from data reported on Census survey forms.
Source: Farmdocdaily