By Gary Schnitkey
Department of Agricultural and Consumer Economics
University of Illinois
Individuals often desire to arrive at an average cash rent given a farm's inherent productivity. Herein, a method is presented for determining a 2017 benchmark rent based on that parcel's productivity index. Given the variability in rents, a parcel's actual cash rent can vary from the benchmark rent. Landowners should expect farmers to attempt to re-negotiate lower cash rents if the 2017 cash rent is near or above the 2017 benchmark rent.
Productivity Indexes
Productivity indexes (PIs) published in Bulletin 811, entitled Optimal Crop Productivity Ratings for Illinois Soils, often are used to quantify yield potential of Illinois soils. This publication gives PIs for different soil types. Higher PIs typically are associated with higher corn and soybean yields.
Figure 1 shows a map made available by the National Resources Conservation Service (NRCS) of PIs across Illinois, with dark green colors reflecting higher PIs, and yellow and red colors being associated with lower PIs. As expected, the highest PIs are located in east-central, west-central, and northern Illinois. The counties with the highest PIs are Piatt (east central with 138 PI), Macon (east central with 137 PI), Champaign (east central with 136 PI), Logan (east central with 135 PI) and DeKalb (northern with 135 PI). The counties with the lowest average PIs are located in southern Illinois: Williamson (85 PI), Calhoun (89 PI), Johnson (91 PI), and Perry (92 PI), and Monroe (94 PI).
Cash Rents, PIs, and CRDs
To quantify a relationship for determining benchmark rents, 2017 county cash rents were explained by an equation fit using linear regression. The average 2017 cash rents by county come from the National Agricultural Statistical Service (NASS). A map showing these rents are in an October 3rd farmdoc daily article.
Two sets of variables were used to explain the variability in 2017 cash rents. The first is average county PIs. County PIs were obtained from AcreValue, an online tool developed by Granular that provides estimated farmland values and soils information. AcreValue provides a list of average county PIs based on Bulletin 811 that is available here.
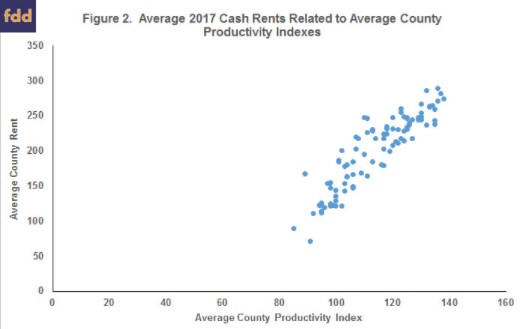
As expected, average county cash rents are highly related to average county PIs, as illustrated in Figure 2 showing a scatter graph of dots representing counties in Illinois, with a county's average PIs indicated on the horizontal axis and its cash rent is on the vertical axis. For illustrative purposes, Schuyler County is identified. Schuyler County has a 102 average PI as indicated on the horizontal axis and a $200 per acre cash rent as indicated on the vertical axis.
The second set of variables related to location as represented by Crop Reporting Districts (CRDs). CRDs are specified by the U.S. Department of Agriculture and contain counties of roughly similar agricultural characteristics (see Figure 3). The ten CRDs were included to capture any difference in rents caused by geographical area. A host of factors could cause rents to vary by region. Weather varies from northern to southern Illinois, with northern Illinois weather being more conducive to less variable crop production. Competitive pressures among farmers for rented land may vary across state. Locations and number of grain outlets and input suppliers also could influence profits.
Quantifying the Average Cash Rent for PI and Location in the State
The two sets of variables - PI and CRDs - explain 91% of the variability in average 2017 county rents. The equation giving benchmark cash rent is:
Benchmark cash rent = -147 + 2.79 x PI + CRD adjustment
The average CRD adjustments are shown in Table 1.
The above equation can be used to arrive at the 2017 benchmark rent adjusted for PI and location. To illustrate, take a farm with a PI of 134 that is located in Champaign County. Champaign County is in the East CRD. The adjustment factor for the East CRD is $26 (see Table 1). Given this information, the average cash for this farm is $253 per acre (-147 + 2.79 * 134 PI + $26 CRD adjustment).
Interpreting the Average Cash Rent
Actual 2017 rents can vary from the benchmark rents given by the above equation. In the above example, the Champaign County farm with a 134 PI had a suggested average cash rent of $253 per acre. For parcels in Champaign County with a 134 PI, there will be a few rents that exceed $300 per acre. Other rents will be below $210 per acre.
There are many reasons why cash rents will vary from parcel to parcel. Some of the difference will be related to the attributes of the farmland including:
- Size of fields within the parcel. Farms that have larger fields will generally be preferable and receive higher cash rents. Small parcels with fields below 40 acres in size could receive lower cash rents.
- Drainage. Farms that have excellent drainage will receive higher cash rents than those farms that have drainage issues.
- High risk farms. High risk areas often are near creeks and rivers that are prone to flood. Farms that have high risk areas likely will receive lower rents.
- Farms with varying soil types. Having similar soils throughout a field make it easier for the farmer to manage. Fewer soil types in a field will result in lower cash rents.
- Farms with topography. A great deal of topography on a farm can result in lower cash rents. Farms that require contour planting are more difficult to manage. Farms could also have low spots that will collect water in high moisture years. Those low spots could result in drowned outs and low yields.
- Farms near grain delivery points and input suppliers. Lower costs can occur for farms near grain delivery points and input suppliers resulting in higher cash rents/
- Obstructions in the fields. Fields that have obstructions that need to be "farmed around" will be less preferred and may receive lower rents. Obstructions can include waterways, electrical power lines, wind turbines, and cell towers.
- Shape of the fields. Generally square and rectangular fields are preferred to those with irregular boundaries.
Desires of the landowner also play a role in cash rent level. Those landowners who place no land use restrictions on the farmer and have fewer concerns about the long-term sustainability of the farmland can expect to receive a higher cash rent. Those landowners that desire conservation practices should expect lower cash rents.
Cash rents also are influenced by the services offered by the farmer. Some farmers provide a great deal of maintenance to the property including waterway and other conservation structure upkeep. Additional services may lower the cash rent.
Finally, some landowners are greatly concerned that farmers generate a sufficient income from the property, with a "sufficient" income being somewhat ambiguous. Other landowners are not concerned with the level of return going to the farmer. Those landowners not concerned about the farmer return often receive higher cash rents than those that do care about the farmer return.
Finding the PI for a Farm
Finding the 2017 benchmark cash rent requires finding the average PI for a farm. Many landowners already know the PI for the farm. In these cases, it is relatively straightforward to arrive at the benchmark rent using the above formula.
In other cases, the landowner does not know the PI but has a list of acres and soil types on the farm. In this case, the farmer can find the PIs by soil type in Table S2 in Bulletin 811. As an example, take the example farm in Table 2 that has 80 acres in Ipava silt loam soil type, and 50 acres in Virden silty clay loam. The PIs for the two fields are in 811: 142 for Ipava silt loam and 135 for Virden silty clay loam. Note that finding the PI in Table S2 is aided by having the "Il Map Symbol" which for the two cases are 43 for Ipava silt loam and 50 for Virden silty clay loam. Given these soil types and acreages, this farm has an average PI of 138:
138 = (142 PI for Ipava x 30 acres + 135 PI for Virden x 50 acres) / 80 acres
Sometimes a landowner will not have the soil types in a farm. These can be obtained online using a Web Soil Survey tool. Landowners can locate their farms as an "area of Interest" within the tool. Once identified, soil types for that "Area of Interest" will be detailed.
Landowners can also use the Acre Value tool by Granular. In this tool, a landowner can locate the farm. Once located, a report will give the soil types and the average PI for that parcel.
Cash Rents for 2018
Average cash rents have declined somewhat from highs experiences in 2014 (see farmdoc daily, August 8, 2017). However, average cash rents have not declined enough for farmers to be profitable. Since 2014, farmers who have paid cash rents at average levels have generatlly generated either very low or negative returns from cash rent farmland (see farmdoc daily, August 22, 2017). Projections are for continued low returns into 2018 (see farmdocDaily, July 25, 2017). As a result, there will be downward pressure on cash rents. Given mid-$3 per bushel corn prices and mid-$9 soybean prices, cash rents would need to decline more than $30 per acre from 2017 average levels for farmers to generate sufficient returns. As a result, landowners that have cash rents near or above averages should expect their farmers to request lower cash rents for 2018.