By Scott Irwin
Department of Agricultural and Consumer Economics
University of Illinois
The ethanol industry has been much in the news in recent months with the ongoing political battle over the future of the RFS (e.g, farmdoc daily, February 28, 2018). It is easy to lose track of what is actually going on with the ethanol industry itself in this environment. Ethanol production profits were quite strong over 2013-14, moderated over 2015-2016, and appeared to take a further dip in 2017. We estimate the profitability of U.S. ethanol production in 2017 and find that it did indeed drop compared to recent years. We explore the reasons for this drop in profitability.
Analysis
A model of a representative Iowa ethanol plant is used to track the profitability of ethanol production. It is the same basic model that has been used the last several years in numerous farmdoc daily articles to estimate the profitability of ethanol production in the U.S. (e.g., March 5, 2015; January 6, 2016; February 1, 2017). The model is meant to be representative of an "average" ethanol plant constructed in the last decade. There is certainly substantial variation in capacity and production efficiency across the industry and this should be kept in mind when viewing profit estimates from the model. Some of the model assumptions include:
- Dry mill plant constructed in 2007
- 100 million gallon annual ethanol production capacity
- Plant construction costs of $2.11 per gallon of ethanol production capacity
- 40% debt and 60% equity financing
- 8.25% interest on 10-year loan for debt financing
- A total of $0.21 fixed costs per gallon of ethanol produced
- Non-corn, non-natural gas variable costs (including denaturant) of $0.21-$0.26 per gallon in 2007-2011
- Non-corn, non-natural gas variable costs excluding denaturant of $0.16 -$0.17 per gallon after 2011
- Variable denaturant costs after 2011 computed as 2 percent of wholesale CBOB price
- 30 cubic feet of natural gas per gallon of ethanol
- 2.80 gallons of ethanol (including denaturant) produced per bushel of corn processed
- 16 pounds of dried distillers grain (DDGS) produced per bushel of corn processed
- 0.55 pounds of corn oil per bushel of corn processed (starting in January 2012)
- Netback (marketing) costs of $0.05 per gallon of ethanol and $4 per ton of DDGS.
To track plant profitability over time, weekly ethanol and DDGS prices at Iowa ethanol plants are collected starting in late January 2007. Crude corn oil prices for the Midwest are available from OPIS. Natural gas costs over 2007-2013 are estimated based on monthly industrial prices for Iowa available from the EIA. Since January 2014 the Iowa industrial price has only been reported sporadically, and when reported, has been out-of-line with its historical relationship to nearby natural gas futures prices. Consequently, a regression relationship between nearby natural gas futures prices and natural gas costs over 2007-2013 is used to estimate natural gas costs starting in January 2014.
Figure 1 presents the three components of plant revenue per gallon--ethanol, DDGS, and corn oil--on a weekly basis from January 26, 2007 through March 2, 2018. The chart shows that ethanol prices (net of netback marketing costs) started 2017 at historically low levels of about $1.30 per gallon, rose to a peak of about $1.60 in June, and then fell most of the rest of the year, reaching a low of $1.17 in late December. The December low was very close to the lowest weekly price for ethanol in this time period ($1.15). DDGS prices were low for most of 2017, but started rising sharply last fall, a trend that has continued into 2018. The combination of low ethanol and DDGS prices depressed total revenue throughout 2017, with an annual average total revenue $1.76 per gallon, easily the lowest over this period. Figure 2 shows the four major cost components for producing ethanol. The cost of corn is the major input cost, about 70 percent of variable and fixed costs on average, and since the price of corn was relatively stable in 2017, total costs tended to fluctuate in a relatively narrow band of about $1.45 to $1.55 per gallon.
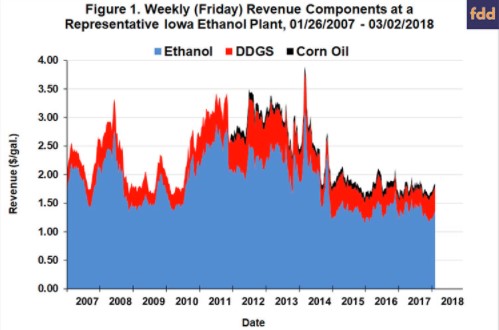
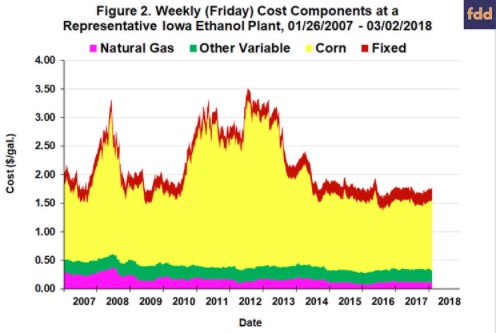
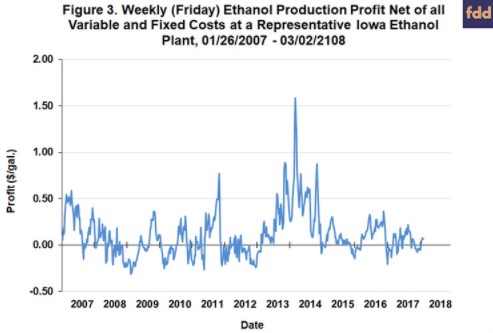
Figure 3 presents (pre-tax) estimates of ethanol production profits net of all variable and fixed costs. Net profits in 2017 averaged only $0.03 per gallon, compared to $0.12 in 2016 and $0.07 in 2015. Two patterns stand out in the data on net profits for 2017. First, profitability was negative for the most number of weeks since 2012. Second, profitability declined substantially in the fourth quarter of the year. After reaching a peak for the year of $0.22 in mid-September, profits rapidly dropped into the loss column and stayed there for much of the remainder of the year.
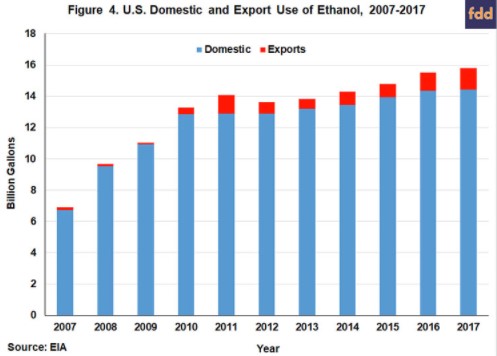
An obvious question is what caused the downturn in ethanol production profits in 2017? We start investigating this question by looking at the trend in total use of ethanol in the U.S. over 2007-2017 in Figure 4. There has been a nice jump in total usage since 2014, from 14.3 to 15.8 billion gallons. The 1.5 billion gallon increase represents a 10.6 percent increase. The increase was split between a rise of about 1 billion gallons for domestic use and 500 million gallons for exports. These trends indicate that the downturn in profitability cannot be traced to a downturn in usage.
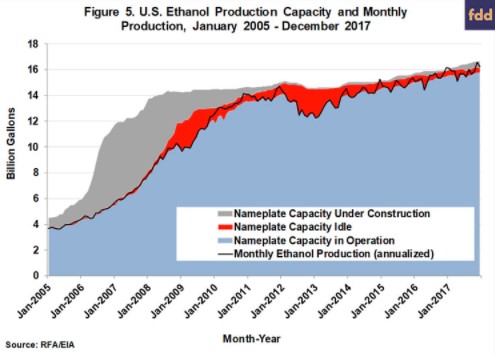
As a next step, we examine trends in monthly ethanol production capacity and monthly production over January 2005 through December 2017 in Figure 5 (the capacity data were provided by the
Renewable Fuels Association). Nameplate production capacity, idled capacity, and new construction are included in the figure and tell an interesting story in recent years. After the extraordinarily high profits of 2013-2014, the ethanol industry in the U.S. responded in four ways: i) nameplate capacity at existing plants was steadily increased a total of over a billion gallons, ii) production exceeded nameplate capacity in operation by an average of 1.6 percent, iii) idled capacity was reduced by 59 million gallons by bringing back online five plants, and iv) construction at five new plants was started. The net result was that total operable capacity of U.S. ethanol plants by the end of 2017 rose to 16.2 billion gallons. Figure 5 shows that monthly ethanol production (annualized) increased in parallel with the rise in production capacity. From the beginning of 2015 through the peak in monthly production in November 2017, ethanol production increased a total of 1.9 billion gallons. Note that ethanol production on a few occasions in recent years actually exceeded the sum of total nameplate capacity, idled capacity, and new capacity under construction. This highlights just how hard the ethanol industry has at times pushed run rates in order to maximize production.
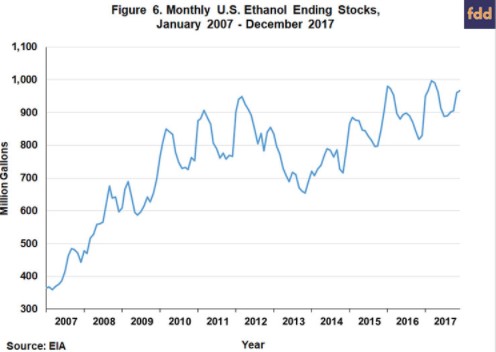
The picture that emerges from our review of Figures 4 and 5 is one of surging ethanol production simply overwhelming rising domestic and export use. This is seen directly in Figure 6, which plots monthly ethanol stocks in the U.S. over January 2007 through December 2017. The upward trend in stocks since 2014 is obvious, with peaks of almost a billion gallons at times. The rising stocks provide clear quantitative evidence that production has risen even faster than use since 2014 and this is the source of the downward pressure on ethanol prices and production profitability. It is interesting to note that the trend of rising stocks has continued into 2018, with the latest weekly report from the EIA indicating ethanol stocks of 1.02 billion gallons.
A final perspective on 2017 profitability is provided in Figure 7, where the profit margins are aggregated over an annual horizon for 2007-2016. Profits are presented in terms of both total pre-tax net returns and percent return to equity. The 2017 net profit of $2.6 million was the fourth lowest over 2007-2017 and well-below the annual average for the entire period of $11.4 million. Despite the downturn, 2017 represented the fifth consecutive year of positive ethanol production profits. The total cumulative (pre-tax) return to equity holders for the 2007-2017 period now stands at $124.1 million, slightly less than the assumed equity investment for the representative plant of $126.6 million. We can use the average net profit for the representative plant to make a rough estimate of profit for the entire U.S. ethanol industry in 2017. Assuming all plants in the industry earned a net profit of $0.03 per gallon and that total ethanol production for the U.S. was 15.8 billion gallons in 2017, aggregate ethanol industry (pre-tax) profits can be estimated at $474 million.
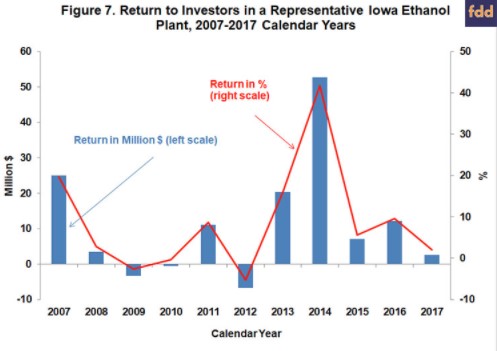
Finally, the percent return to equity holders provides useful information on the attractiveness of investment in ethanol plants relative to other investments. The average return was 8.9 percent over 2007-2017 and the standard deviation, a measure of risk, was 13.3 percent. By comparison, the average return for the stock market over this period, as measured by the S&P 500, was 9.8 percent and the associated standard deviation was 18.1 percent. The ratio of average return to standard deviation provides one measuring stick of an investment's return-risk attractiveness, and on this measure the ratio for ethanol investment, 0.67, compares favorably with the ratio for the stock market as a whole, 0.54.
Implications
The U.S. ethanol production industry struggled in 2017. Net profits for a representative Iowa ethanol plant averaged only $0.03 per gallon, compared to $0.12 per gallon in 2016. The 2017 total net profit of $2.6 million for the representative plant was the fourth lowest over 2007-2017 and well-below the annual average over 2007-2017 of $11.4 million. The story behind the declining fortunes of the ethanol industry is straightforward. Domestic and export use for U.S. ethanol has increased nicely since 2014, but production capacity and actual production increased even faster. The surge in production basically overwhelmed the rise in use, which caused ethanol stocks to increase and ethanol prices and profits to fall. The fortunes of the U.S. ethanol industry are unlikely to improve until production and use are better balanced. Based on recent production and stocks data it looks like this could take some time.