A well-planned and run on-farm trial is a great way to test new ideas, products, and equipment. But, to provide meaningful information, even a simple on-farm trial takes time to plan and carry-out.
For an on-farm trial to provide useful information, two basic requirements need to be met. First, the trial has to be set up in a way that all the production variables (e.g. drainage, fertilizer, tillage, etc.) are kept constant across the plot, with the exception of the treatment (e.g. hybrids, fungicide, plant population, etc.) being tested. Second, to have confidence in the results generated, the trial has to be set up in a way that the data collected can be statistically analysed. This is mostly code word for the need to replicate and randomize (arranged each treatment in a different order in each replication) the trial.
The following are guidelines for setting up on-farm trials:
Planning
Determine the objective of the trial and identify the information which will need to be collected (e.g. variety, planting date, yield, % residue cover, etc.). Without replicates, it is impossible to know if measured treatment differences are real or just due to random chance or error. Designing a simple plot with only 2 or 3 treatments (e.g. a foliar fungicide on corn compared to a non-treated check) will make it easier to replicate each treatment at least twice, but preferably 3 or 4 times in the field.
To be confident that there is sufficient data for real and defendable analysis of the results, a minimum of 6 plots is required for a trial, which can be a combination of treatments and replicates. Therefore, if you only compare 2 treatments, then you need 3 replicates (2 x 3 = 6). The exception to the 6 plot minimum would be for some of the corn hybrid plots, like the ones done by the seed industry, where each location is used as a replicate, with the same hybrids entered at multiple locations. This will provides sufficient location replications for proper data analysis.
Actual block widths should be based on the width of the equipment used (planter, sprayer, combine header, etc.). Each treatment plot (strip) should be at least 500 feet long and large enough to yield at least 1,000 lbs of harvested crop to minimize the impact of inherent measurement and weighing errors. When comparing inputs such as fertilizer rates, the rate difference between treatments needs to be large enough to produce a measurable impact on yield (e.g. a difference of at least 30 lbs/acre of actual nitrogen for corn).
Field Selection
Ideally, the field should be uniform in slope, drainage, and fertility, and of a soil type that is representative of your farm. If the field has a slope, orient the plot so the treatments run vertically up and down the slope. Locate plots at least 100 feet away from fence rows and up to 200 feet away from large trees. When possible, the trial should be planted perpendicular (90o angle) to known sources of potential variables such as tile lines, primary tillage or dead furrows and field operations (e.g. fertilizer, manure application). This reduces the potential for added variability that may be associated with overlaps or misses of crop inputs.
The goal is to reduce inherent or applied variation in the whole plot to ensure observed treatment differences are real and not due to unrelated underlying variations. It is critical to observe the field over the course of the season. Be prepared to use your best judgement as to whether there are things happening in the field that could impact the results that weren’t associated with treatment differences. You have to be prepared to abandon the plot results if it is obvious that there is something wrong with the overall project site.
Plot Layout
Design the plot on paper or electronically, including replication and randomization positions, ensuring that sufficient field space is available for the trial. Ensure that treatments are well marked, which will make treatment position obvious throughout the season.
Figure 1 is an example of a replicated (3 replications and randomized) plot for 3 treatments.
Figure 1. Plot Replication (3 treatments X 3 replications)
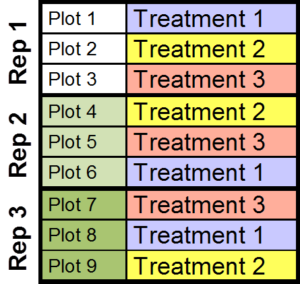
Figure 2 is a block layout option for a plot with 2 treatments and 4 replications. This layout works well when using wide equipment such as a 100 ft boom sprayer (e.g. foliar fungicide application).
Figure 2. Block layout option for a plot with 2 treatments and 4 replications.
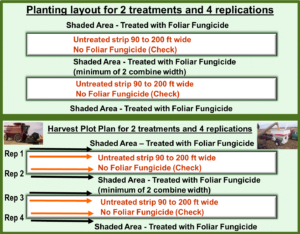
In figure 2, a strip is harvested and weighed from each of the side-by-side treatments (e.g. with and without fungicide on both sides of the block), for a total of 8 data points.
Harvest
Weigh wagons are more accurate than yield monitors to collect harvest weights. If using a yield monitor, the monitor should be calibrated and all the plots should be combined in the same direction and at the same speed to reduce error.
Making Use of the Data
Individual farm data is more valuable when combined with plot results from other sites. If you take the time to plan, plant and harvest a plot, make the time to analyse and share your results. Compile the data in a readable format and send it for analysis and aggregation to you Soil & Crop Director, OMAFRA specialist or Agribusiness representative as soon as possible after harvest.
On-farm trials can answer important questions, but requires significant planning and lots of attention to detail. Sound plot design plus statistical analyses can isolate background “noise” to help detect true treatment effects and improve your success in answering questions.
Source: Fieldcropnews