By Gary Schnitkey
Department of Agricultural and Consumer Economics
University of Illinois
The World Agriculture Supply and Demand Estimate (WASDE) report contained its first estimates of 2018/2019 supply and use. Midpoints of their market year average (MYA) prices ranges are $3.80 per bushel for corn and $10.00 per bushel for soybeans. These price estimates, along with trend yields result in U.S. per acre crop revenue above 2017 levels but below 2007-2017 averages. Obviously, these estimates will change. Still, they are useful in framing 2018 expectations.
Background
Each month, the Office of the Chief Economist of the U.S. Department of Agriculture (USDA) releases the World Agriculture Supply and Demand Estimates (WASDE) report. This report gives supply and use tables for many major agricultural commodities. For most of the commodities, there is a supply and use table for the United States that gives estimates of the stocks at the beginning of the marketing year, estimates of U.S. production and imports during the marketing year, estimates of major U.S. uses of commodity and exports during the marketing year, finally resulting in stocks at the end of the marketing year. For crops, estimates of yield per acre, harvested acres, and a range of the Market Year Average (MYA) price also are given.
In its May 2018 report, the Office of the Chief Economist released its first supply and demand estimates for the 2018/2019 marketing year. For corn and soybeans, the marketing year begins on September 1 and ends on August 31. Obviously, much is uncertain about the 2018/2019 year as planting is not yet complete, the critical yield forming months are still in the future, and much can change in the overall demand situation. Still, the May 2018 report contains useful information in forming expectations of 2018 revenue. In the following sections, per acre crop revenue for the 2018/19 marketing year for corn and soybeans are given. These revenue estimates can be used to gain a beginning understanding of 2018 farm incomes.
Corn
For corn, the Market Year Average (MYA) price range for the 2018/2019 marketing year is from $3.30 to $4.30, giving a midpoint of $3.80 per bushel. The $3.80 midpoint will be used as a price forecast.
From 1972 through 2006, corn prices did not trend up or down but varied around a long-run average of $2.36 per bushel (see Figure 1). In 2016, corn price increased. From 2007 through 2016, corn prices averaged $4.42 per bushel, with prices higher than this average from 2010 to 2013. MYA prices were $5.18 in 2010, $6.22 in 2011, $6.89 in 2012, and $4.46 in 2013.
Since 2013, MYA corn prices have been below $4.00 per bushel: $3.70 in 2014, $3.61 in 2014, $3.36 in 2016, and a projected $3.40 for 2017. A $3.80 price for the 2018 marketing year would be above prices from 2014 to 2017. Therefore, a $3.80 price is relatively optimistic compared to prices in recent years. However, a $3.80 price would still be below the $4.42 average for the 2006-2017 period.
A U.S. average yield of 174 bushels per acre is used in the May 19th WASDE report. The 174 bushels per acre is based on a trend yield estimated using weather adjusted yields from 1988 to 2017 under the presumption of normal planting in 2018 (see footnotes on page 12 of May 2018 WASDE report). Figure 2 shows national corn yields from 1972 onward and the green line shows a linearly fitted trend line for data from 1988 to 2017. While the trend values in Figure 2 are not weather adjusted, they result in roughly the same 2018 trend value as used in the May 2018 WASDE report.
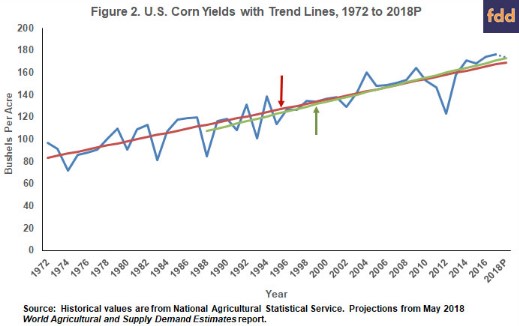
From 2014 to 2017, all U.S. corn yields were above trend. During this period, corn prices were below $4.00 per bushel. Corn yields were below trend from 2010 to 2013, the period in which corn prices were above the $4.42 mean price for the 2007-2017 period. There is a strong, negative correlation between actual-trend yield changes and price changes. It is likely that a below trend yield in 2018 would result in a price above the $3.80 midpoint projection, and vice versa.
Figure 2 also includes a trend from 1972 to 2017. That trend is relatively close to the 1988-2016 trend and is included to make a point about yield variability. In the last 20 year, there have been relatively few yields below trend. From 1998 to 2017, yields have been below trend in 6 years, or in 30 percent of the years. For the 1972 to 1997 period, yields were below trend in 46 percent of the years. Breeding, farming practices, and good growing conditions contribute to the fewer years below trend in recent years. Whether this will continue is an open question. History would suggest a period of more yield variability is not out of the question.
The above 2018 price and yield projections can be used to project 2018 crop revenue. Multiplying a $3.80 corn price time a 174 bushel per acre trend yield results in $661 per acre. A $661 crop revenue would be above recent crop revenue since 2013 (see Figure 3). Crop revenue was $633 per acre in 2014, $608 per acre in 2015, $587 per acre in 2016, and $600 per acre in 2017. A $661 revenue in 2018 would be $60 higher than the $600 per acre revenue in 2017. Still, a $661 per acre revenue in 2018 would be below the $684 average for the 2007-2017 period.
Soybeans
Soybeans have exhibited many of the same price trends as did corn. From 1972 to 2006, soybean prices did not trend up or down but varied around a long-run average of $5.93 per bushel (see Figure 4). In 2006 soybean prices increased and averaged $10.43 per bushel from 2007 to 2017.
For soybeans, the May WASDE report gave a 2018/19 MYA price range from $8.75 per bushel to $11.25 per bushel, with a $10 per bushel midpoint. A $10 midpoint would be below the $10.43 average for the 2006-2017 period. A $10 price would be above recent MYA prices. MYA prices were $8.95 in 2015, $9.47 in 2016, and a projected $9.35 in 2017.
The 2018 trend yields for soybeans is 48.5 bushels per acre (see Figure 5). The 48.5 trend yield would be below the 52 bushel per acre yield for 2016 and the 49.1 yield for 2017. Soybeans yield have been exceptional in recent years.
Unlike corn, there have been more years with below trend yields in the last twenty years than from 1972 to 1997. From 1998 to 2017, U.S. soybean yields have been below trend in 50 percent of the years (10 out of 20 years) compared to 38% of the years from 1972 to 1997 (10 out of 26 years). The last 20 years of yields have been associated with many yields below trend from 1998 to 2013, and then exceptional yields from 2014 to 2017. Whether this will continue is an open question.
Multiplying a $10.00 MYA price by a 48.5 bushel per acre trend yield results in $485 per acre. Crop revenue for soybeans has been choppy since 2013 (see Figure 6). Crop revenue was $480 per acre in 2014, $429 for 2015, $492 in 2016, and $459 in 2017. A $485 projected 2018 revenue is $26 per acre higher than the $459 crop revenue for 2017. The 2018 projected revenue is $6 per acre higher than the 2007-2017 average of $479 per acre.
Summary
For corn and soybeans, midpoints of WASDE price ranges for 2018/2019 are higher than MYA prices in recent marketing years. Using midpoint prices in combination with trend yields result in 2018 crop revenues that are above 2017 crop revenues, presenting some optimism for 2018 incomes. Still, 2018 revenues are projected below 2007-2017 averages. Moreover, commodity title payments likely will be lower for 2018 compared to recent years, offsetting a portion of the potentially higher crop revenues.
Still, there is a bit of optimism for 2018 incomes. Obviously, much will be determined over the next several months as actual plantings and yields come into clearer focus.