By Scott Irwin
Department of Agricultural and Consumer Economics
University of Illinois
In the Crop Production report released on October 10, 2017 the USDA estimated the U.S. average yield of corn to be 171.8 bushels per acre and the average yield of soybeans to be 49.5 bushels per acre. The October yield estimates confirmed that U.S. corn and soybean yields in 2017 would be rather large by historical standards. The estimated corn and soybean yields for 2017 are the second largest ever for the U.S. The "high" yield estimates released by the USDA since August have surprised many market observers and analysts based on the perception that crop condition ratings and weather during the 2017 growing season did not support an expectation of such large yields. The purpose of this article is to examine whether those perceptions were accurate or not.
Analysis
We begin by providing a historical perspective on USDA 2017 corn and soybean yield estimates for the U.S. Figure 1 shows the U.S. average yield of corn over 1960 through 2017, with the October 2017 USDA projection used for 2017. From a long-term perspective, the 2017 U.S. average corn yield of 171.8 bushels per acre does not appear to be much out of the ordinary, as it is not far from the estimated trend over this period. Figure 2 shows that the corn trend yield deviation for 2017 is 5 bushels per acre, but this would be only the 20th highest positive trend deviation of the last 58 years. The 2017 corn yield is good but certainly nowhere near that of truly outstanding years such as 1994 and 2004.
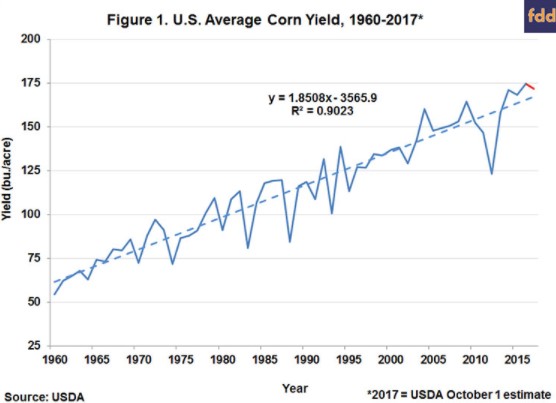
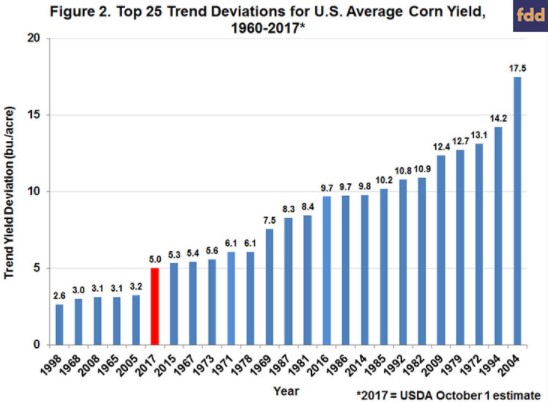
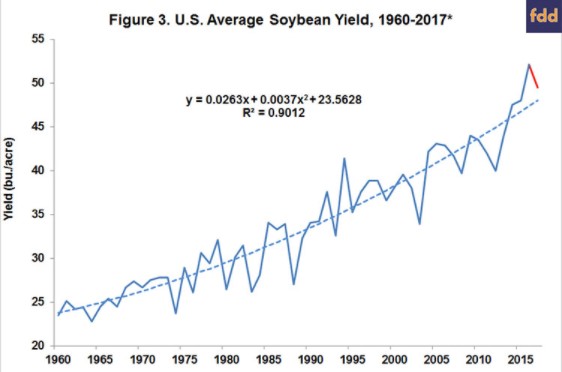
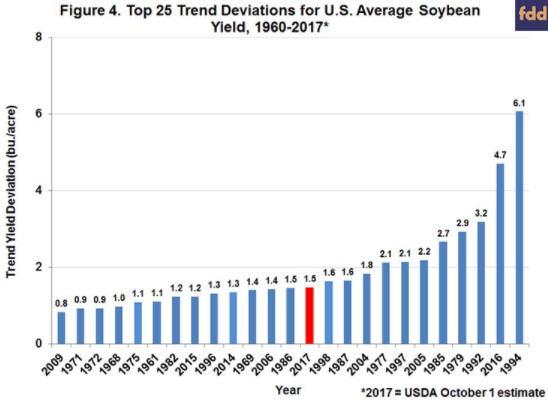
Figure 3 shows the U.S. average yield of soybeans over 1960 through 2017, with the October 2017 USDA projection again used for 2017. One thing to note at the outset is that a quadratic curvilinear trend is used for soybeans (farmdoc daily, May 10, 2017). This choice does impact one's perspective on the 2017 U.S. average yield of 49.5 bushels per acre. With this caveat, the 2017 soybean yield also does not appear to be greatly out of the ordinary. Figure 4 shows that the soybean trend yield deviation for 2017 is 1.5 bushels per acre, which would be the 12th highest positive trend deviation of the last 58 years. Like corn, the 2017 soybean yield is good but nowhere near that of truly outstanding years such as 1994 and 2016. It is interesting to note the higher rank of the 2017 trend yield deviation for soybeans compared to corn. This suggests 2017 was a stronger year overall for soybean yields compared to corn.
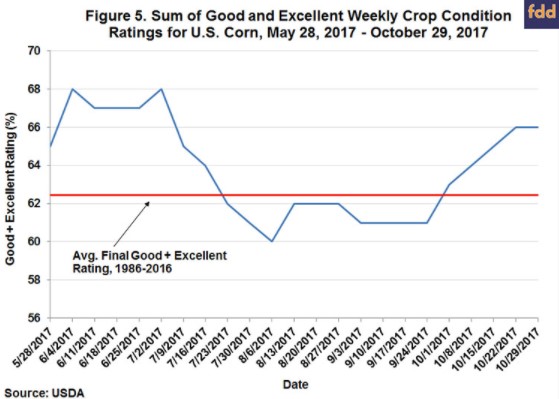
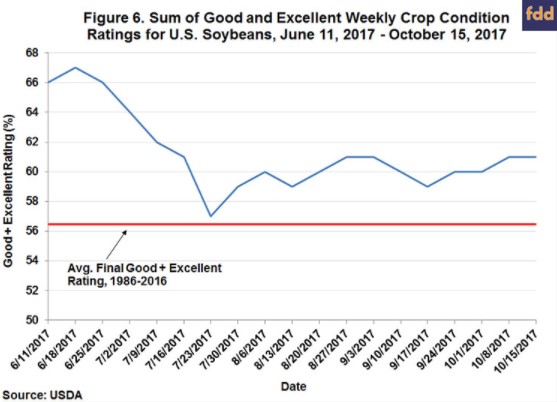
The next step in the analysis is to examine USDA weekly crop conditions to see whether they were unusually low relative to corn and soybean yields during 2017. The way in which weekly crop condition ratings are used to judge corn and soybean yield potential likely varies considerably. However, it is common to use the combined percentage of the crop rated good (yield prospects are normal) and excellent (yield prospects are above normal) at any point in the growing season to quantify average yield expectations. Figure 5 shows the sum of weekly good and excellent condition ratings for U.S. corn between May 28, 2017, the first rating, and October 29, 2017, the final rating. The average final sum of good and excellent ratings over 1986 through 2016 is also included for perspective. Corn condition ratings started relative high around 66 to 68 percent, which is the norm (see the farmdoc daily article of June 1, 2017 for further discussion), dropped to 60 by late July, stabilized through late September in the low 60s, and then rose again late in the season. During much of the growing season, corn condition ratings were near or just below average final ratings. Figure 6 shows the sum of weekly good and excellent condition ratings for U.S. soybeans between June 11, 2017, the first rating, and October 15, 2017, the final rating. Not surprisingly, the pattern of soybean ratings is similar to that of corn. What is notable is that soybean condition ratings after late June, with the exception of one week, exceeded the historical average end of season rating by around 3 to 4 percentage points. This is consistent with the previous observation that the trend yield deviation for soybeans outranked that for corn in 2017.
Comparison of condition ratings in 2017 relative to historical end of season averages is useful, but it does not directly address whether the ratings were low or high relative to yields. In order to make that comparison a forecasting model based on condition ratings is needed. Figures 7 and 8 present the simple forecasting models for corn and soybeans, respectively, developed in the farmdoc daily article of May 24, 2017. The models are based on the expectation that the relationship between yield (adjusted for trend) and the combined percentage of the crop rated in good and excellent condition would be the strongest at the end of the growing season when uncertainty about growing conditions has been largely resolved. The models are estimated by first using a linear trend regression to trend adjust yields over 1986-2016 and then regressing the trend-adjusted yields on end-of-season condition ratings (linear and quadratic trends produce similar results in soybeans for this shorter sample). The sample starts in 1986 because this is the first year that national average crop condition ratings were made available by the USDA. The percentage of the corn crop rated good or excellent in the final report of the year explained nearly 85 percent of the annual variation in the trend-adjusted U.S. average corn yield and about 71 percent of the variation in trend-adjusted soybean yields. These strong relationships explain why market participants follow crop condition ratings closely to judge yield potential.
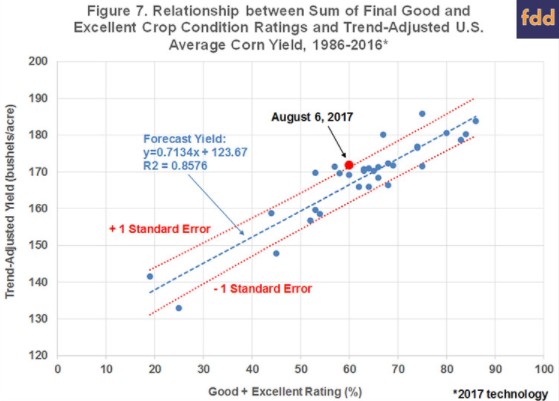
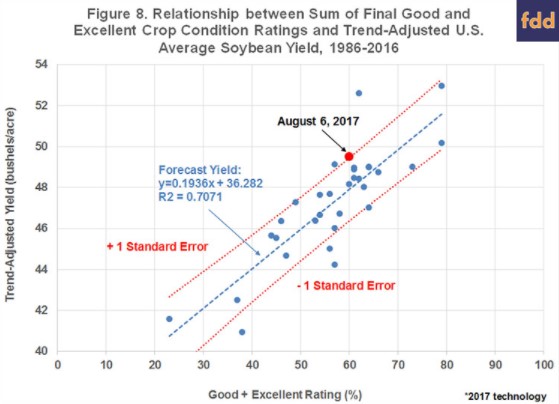
Figures 7 and 8 also present one standard error confidence bands to provide an idea of the uncertainty inherent in making forecasts using crop condition models to project yield. The one standard error bands are around 5-6 bushels wide in corn and 1.5 bushels wide in soybeans. These bands provide a range around yield forecasts that roughly 68 percent confident contains the actual yield. These confidence bands are quite useful for understanding whether crop condition ratings this summer were unusually low relative to actual yield outcomes. In each figure, the large red dot represents the combination of good and excellent condition ratings on August 6, 2017 and the final 2017 yield as estimated by the USDA in the October Crop Production report. Coincidentally, the combined good and excellent rating on this date in August was 60 for both corn and soybeans. For corn, this results in a yield projection of 166.5 bushels per acre, 5.3 bushels less than the current estimate of the final yield. For soybeans, this results in a yield projection of 48.2 bushels per acre, 1.3 bushels less than the current estimate of the final yield. In this sense, crop condition ratings this summer did lead to yield expectations that were too low. However, notice that the red dots in both Figures 7 and 8 lie almost exactly on the upper forecast confidence band. This means that even though crop condition ratings produced forecasts that were low, the errors were within the range of "normal" uncertainty. In fact, the figures show that there were 4 years in corn and 2 years in soybeans with misses on the low side equal to or larger than the estimated misses for 2017.
The final part of the analysis is to review data on weather observations this summer. Table 1 shows monthly precipitation and temperature for the U.S. Corn Belt for June, July, and August 2017. The weather observations are weighted by acreage in 10 Corn Belt states (Iowa, Indiana, Illinois, Minnesota, Missouri, Nebraska, North Dakota, Ohio, South Dakota, and Wisconsin). June precipitation was modestly below average but July and August were very near average. June and July temperature were slightly above average, whereas August was substantially cooler than normal. The averages, of course, mask a great deal of variability across the Corn Belt and within each month. Still, the dominant impression is that weather in the U.S. Corn Belt in the summer of 2017 was near normal with the exception of a cool August. The very cool August temperatures may be important in explaining yields that ended up being somewhat higher than predicted by crop conditions.
Implications
Once again, USDA crop condition ratings and yield estimates for corn and soybeans in 2017 have been controversial. Some market observers and analysts have argued that the condition ratings and yield estimates contradicted one another, with crop condition ratings too low and/or yield estimates too high. We examined crop condition ratings relative to yield and weather observations for 2017 and find little evidence that would support the perception that USDA condition ratings and yield estimates were biased in any direction. Instead, corn and soybean yield projections based on crop condition ratings were within standard error ranges and weather observations for the U.S. Corn Belt were near normal with the exception of a beneficially cool August. The real lesson from 2017 is the uncomfortable degree of uncertainty in corn and soybean yield forecasts made during the growing season.