The USDA will report crop condition ratings for the 2017 U.S corn and soybean crops in the 18 major producing states in the weekly Crop Progress report beginning May 30 and continuing until harvest. Weekly crop condition ratings have been made for all the major producing states since 1986. Market participants typically follow the crop condition ratings closely as an indication of crop health, yield potential, and change in yield potential as the growing season proceeds (e.g., farmdoc daily, July 19, 2011; August 4, 2011; September 9, 2011; July 14, 2016). Recent research documents that these ratings indeed have a substantial market impact during the growing season (Lehecka, 2014). In a farmdoc daily article yesterday (May 23, 2017), Gary Schnitkey showed that early season crop condition ratings do not tell us much about corn yield prospects in Illinois. This naturally leads to the question of when do condition ratings provide useful information about potential yields. In this article, we examine the relationship between crop condition ratings at various times in the growing season and the U.S. average yield of corn and soybeans in order to determine when we should pay serious attention to the ratings.
Background
We start with a brief description of the condition ratings and the procedure for developing those ratings. Our discussion draws mainly from the procedure for surveying crop condition ratings and making crop condition ratings as described in the May 22, 2017 Crop Progress report. For both corn and soybeans, conditions are reported as the percentage of the crop rated to be in one of five categories, described as follows:
- Very Poor - Extreme degree of loss to yield potential, complete or near crop failure. Pastures provide very little or no feed considering the time of year. Supplemental feeding is required to maintain livestock condition.
- Poor - Heavy degree of loss to yield potential which can be caused by excess soil moisture, drought, disease, etc. Pastures are providing only marginal feed for the current time of year. Some supplemental feeding is required to maintain livestock condition.
- Fair - Less than normal crop condition. Yield loss is a possibility but the extent is unknown. Pastures are providing generally adequate feed but still less than normal for the time of year.
- Good - Yield prospects are normal. Moisture levels are adequate and disease, insect damage, and weed pressures are minor. Pastures are providing adequate feed supplies for the current time of year.
- Excellent - Yield prospects are above normal. Crops are experiencing little or no stress. Disease, insect damage, and weed pressures are insignificant. Pastures are supplying feed in excess of what is normally expected at the current time of year.
- The percentages in each of the five categories must sum to 100. For example, the 18-state corn condition ratings on August 1, 2016 were 1 percent very poor, 5 percent poor, 18 percent fair, 56 percent good, and 20 percent excellent. National crop planting progress, progress of development stages, and condition estimates are weighted using the program State's average planted acres over the previous three crop years.
As described in the May 22, 2017 Crop Progress report, progress and condition estimates are based on survey data collected each week from early April through the end of November. The non-probability crop progress and condition surveys include input from approximately 3,600 respondents whose occupations provide them opportunities to make visual observations and frequently bring them in contact with farmers in their counties. While NASS does not provide data on the composition of respondents, it is our understanding that in earlier years the vast majority were county agricultural extension agents, but as the number of agents declined over time they were replaced by others, such as Farm Service Agency staff and elevator managers. Based on standard definitions, these respondents subjectively estimate the progress of crops through various stages of development, as well as the progress of producer activities. They also provide subjective evaluations of crop conditions when the crops are mature enough to make such evaluations.
Analysis
The way in which weekly crop condition ratings are used to judge corn and soybean yield potential likely varies considerably. However, it is common to use the combined percentage of the crop rated good (yield prospects are normal) and excellent (yield prospects are above normal) at any point in the growing season to quantify average yield expectations. It should be expected that the relationship between yield (adjusted for trend) and the combined percentage of the crop rated in good and excellent condition would be the strongest at the end of the growing season when uncertainty about growing conditions has been largely resolved. That relationship for the period 1986 through 2016 is presented in Figure 1 for corn and Figure 2 for soybeans. The percentage of the crop rated good or excellent in the final report of the year explained nearly 85 percent of the annual variation in the trend-adjusted U.S. average corn yield and about 71 percent of the variation in soybean yields. Both corn and soybean yields are adjusted to 2017 technology using linear trends for 1986-2016. That strong relationship explains why market participants follow crop condition ratings closely to judge yield potential. However, from a practical point of view, waiting for the final crop condition rating of the season to form yield expectations is not particularly valuable. The question, then, is whether crop condition ratings earlier in the growing season provide useful information for forming yield expectations?

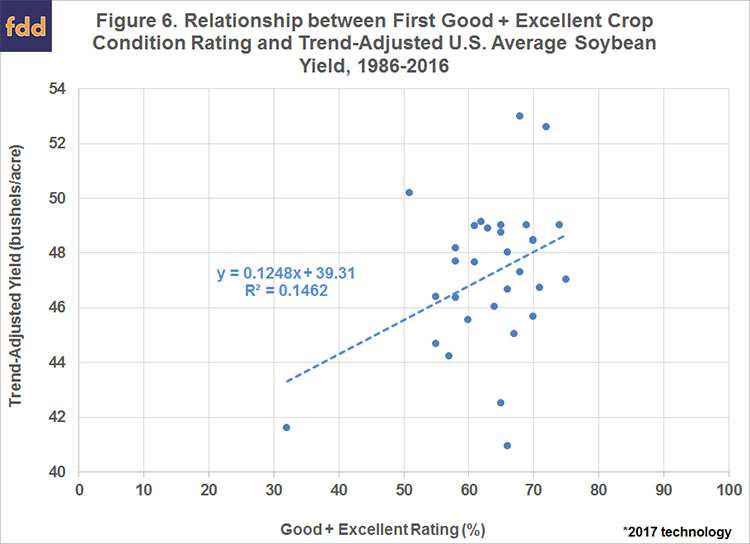
We examine the relationship between trend-adjusted yield and the percentage of the crops rated in good or excellent condition in mid-July (Figures 3 and 4) and the percentage of the crop rated in good or excellent condition in the first report of the year (Figures 5 and 6). The mid-July crop condition rating for corn has a reasonably strong relationship to yield, with crop condition ratings explaining nearly 69 percent of the annual variation in yields. The relationship is not strong for soybeans, however, with the percentage of the crop rated in good or excellent condition explaining only 35 percent of the annual variation in yields.
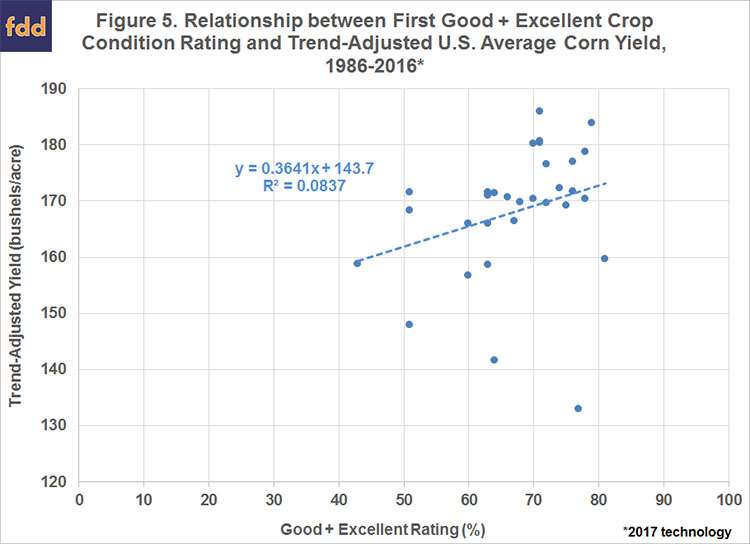
The relationship between trend-adjusted yield and the percentage of the crop rated in good or excellent condition in the first report of the year is low. Condition ratings explain only eight percent of the annual variation in corn yields and about 15 percent of the annual variation in soybean yields. The reason for the poor relationship is apparent in Figures 5 and 6. Compared to ratings in mid-July and at the end of the season, combined good and excellent ratings in the first report of the year have been clustered at the high end of the scale, rarely falling below 60 percent for corn and 50 percent for soybeans.
The previous analysis indicates that the relationship between trend-adjusted corn and soybean yields and crop condition ratings improves dramatically from the first crop condition report of the year to mid-July and then to the final crop condition report of the year. Precisely how early in the season, then, do the crop condition ratings become a useful predictor of final crop condition ratings and/or the trend-adjusted yield? We address that question in Figures 7 and 8. Here, we use a fixed time window for ratings in order to minimize the number of missing observations. Weeks earlier than the first week shown on each chart have substantial numbers of missing observations since the first week of the ratings varies across years. The blue lines in Figures 7 and 8 show the correlation between the percentage of the crops rated in good or excellent condition each week from the end of May to the end of September and the percentage of the crop rated in good or excellent condition at the end of the season. For corn, the correlation over the period 1986 through 2016 approached 0.9 (with 1.0 being perfect correlation) beginning in mid to late-July and then gradually increased to near 1.0 by late September. That is, weekly corn condition ratings have tended to become good predictors of final ratings by mid-July. In contrast, the correlation for soybean ratings reached only 0.8 by late July and then improved slowly through September. The correlation between weekly crop condition ratings and the trend-adjusted yields showed a similar pattern as the correlation to final condition ratings, but not surprisingly, correlations were lower for all weeks.
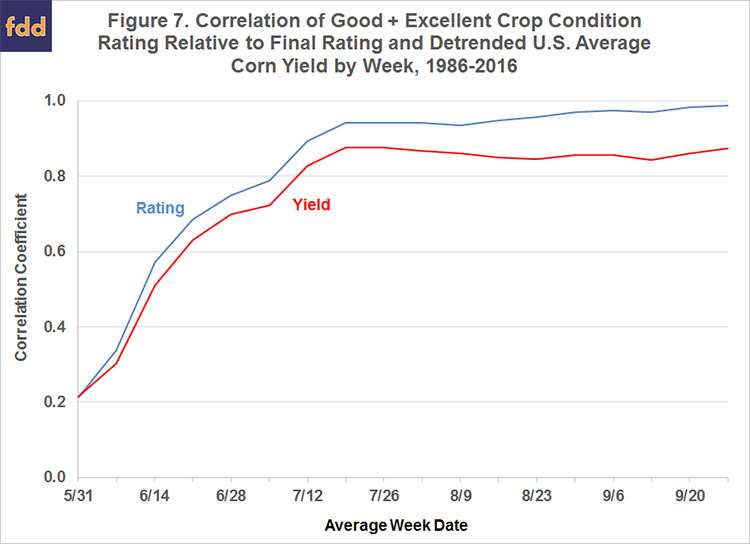
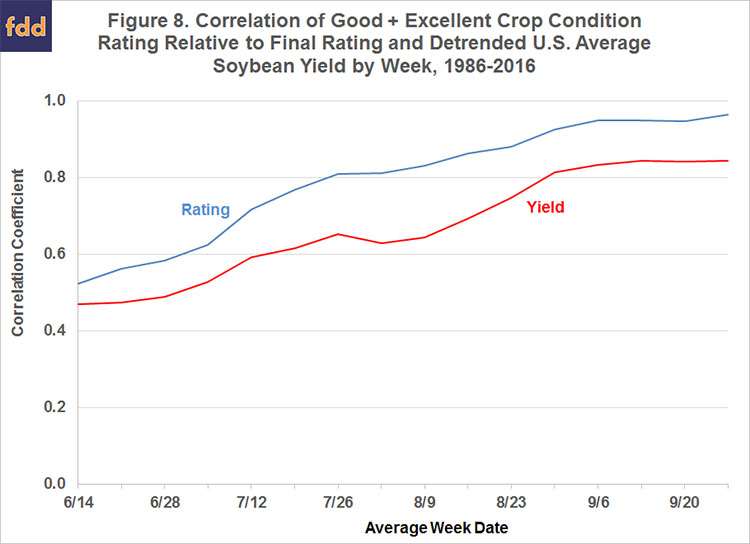
The pattern of the correlations in Figures 7 and 8 make sense in light of the nature of corn and soybean production in the U.S. The critical reproduction period for corn is roughly late June through late July. This is exactly the period where corn ratings adjust to information on growing conditions, and consequently, the correlation with both final ratings and yields rises rapidly. The critical reproduction period for soybeans is roughly late July through late August. Ratings correlations reach their maximum level for soybeans at the end of this period.
So, what is the answer to the question posed at the beginning of this article? That is, when should we start paying attention to crop condition ratings for corn and soybeans? If by "paying attention" one means waiting until ratings provide a relatively accurate projection of yields, then you should wait until mid-July for corn and mid-August for soybeans before making projections based on the ratings. If by "paying attention" one means utilizing the ratings when they provide useful information for projecting yields, then you can use the ratings much earlier. For both corn and soybeans, correlations of ratings with final ratings and yields by mid-June is at or above 0.40. Therefore, the early ratings contain some valuable information about yield prospects, just not as much information as later ratings that reflect growing conditions in the critical reproductive phases of corn and soybeans.
Implications
The analysis in this article indicates that there has been a strong correlation between trend-adjusted U.S. corn and soybean yields since 1986 and the percentage of the crops rated in good or excellent condition at the end of the season. There is an interesting pattern in the correlations across the growing season. The correlations are low early in the season and then rise sharply for corn into mid-July and rise more gradually for soybeans into mid-August. The increasing correlations reflect adjustments in the ratings during the critical reproduction periods for corn and soybeans. While correlations between condition ratings and final yields are lower in the early part of the growing season, and especially poor for the first ratings of the season, ratings as early as mid-June provide some useful information for projecting yields. The key is a proper understanding of the uncertainty inherent in making projections based on early season versus late season ratings. This also raises the issue of any adjustments that should be made to early season ratings in order to make them useful in forming yield expectations. We will examine that issue in a farmdoc daily article next week.
Source: farmdocdaily