By Bradley Zwilling
Illinois FBFM Association and Department of Agricultural and Consumer Economics
University of Illinois
In the July 1, 2022 farmdoc daily article, the author explains trends in working capital using data from the United States Department of Agriculture – Economic Research Service (USDA-ERS) to show trends for all farms in the United States. The article also points out substantial differences in working capital to gross farm revenues among farms. Using data from Illinois Farm Business Farm Management Association (FBFM), this article will identify the differences in working capital to gross farm revenues among farm types and by age of operator on grain farms primarily in Illinois. Overall, working capital to gross farm revenues declined from 2013 to 2019 but has been increasing since then.
Background
The Financial Guidelines for Agriculture developed by the Farm Financial Standards Council (FFSC) identified five general financial measures when evaluating the financial performance of the farm firm. These include liquidity, solvency, profitability, repayment capacity and financial efficiency. Different financial measures were identified and defined for each general group. There are three measures listed for measuring liquidity: current ratio, working capital and working capital/gross revenues ratio. Financial analysis by some groups substitute value of farm production (VFP) for gross farm revenue (GFR). The FFSC recognizes both methods of calculation in their guidelines.
Using FBFM data, this article examines working capital to gross farm revenues for selected producer characteristics. While the traditional measures of a farm’s liquidity, the current ratio and working capital, are common measures historically used, the measurement of working capital to gross farm revenue also takes into consideration a farm’s size. Obviously, a larger farm needs more working capital than a smaller farm to have the same level of liquidity. In addition, the higher this figure, the better, that is stronger liquidity.
Working Capital to GFR by Farm Type
Figure 1 charts the median (50 percent of the farms above and below this figure) measurement of working capital to GFR by farm type. The four farm types are hog, grain, dairy and beef farms based on FBFM’s definition of these farms. Grain farms are defined as farms where the value of feed fed was less than 40 percent of the crop returns. Hog, beef and dairy farms are defined as farms where the value of feed fed was more than 40 percent of crop returns and the livestock enterprise (hog, dairy or beef) received the majority of the value of feed fed.
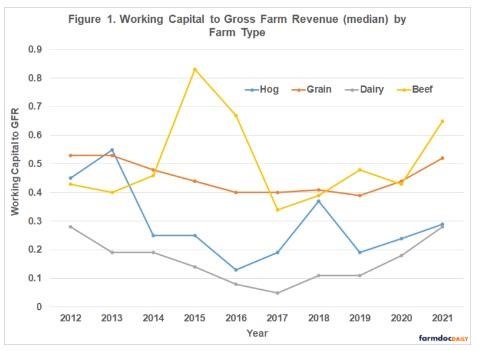
Generally, working capital to GFR has declined from 2013 to 2019 for most farm types. The 2012-13 period was the end of the era of high grain prices started by the ethanol mandate and ending with drought year of 2012. From 2013 to 2019, we saw financial deterioration in most farms as farm incomes declined. Since then, higher grain prices have led to increasing farm incomes allowing for greater returns for farmers and increasing of working capital.
Hog and beef farms seem to have more variability in this measure. This is explained by the fact that the variability of livestock prices not only effects livestock sales for the year but also has an effect on inventory values that come into play when calculating accrual farm incomes. Finally, dairy farms have a lower working capital to GFR than the other three farm types. The majority of a dairy farm’s assets are in the dairy herd, an intermediate asset, and buildings, a long-term asset. Dairy farms also benefit from a monthly income stream in milk sales that allow them to survive on lower liquidity.
Working Capital to GFR on Grain Farms by Operator Age
Figure 2 charts the median measurement of working capital to gross farm revenue on grain farms by the age of the operator. The groups are divided into five different age groups ranging from less than thirty years old to sixty years old and older.
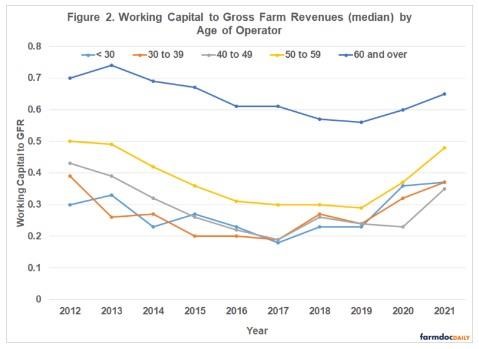
Similar to working capital to GFR by farm types, all these measures of liquidity declined from 2013 to 2019 and have been rising since. For example, the ratio for the group of fifty- to fifty-nine-year-olds started at .50 in 2012, dropped to .29 by 2019 and has increased to .48 in 2021 or almost to the ten-year high in 2012. The decrease from 2012 to 2019 was a deterioration of about 42 percent but has almost rebounded in the last two years.
On average, working capital is stronger for farmers that are in the “50 to 59” and “over 60” age groups compared to younger farmers. Generally, older farmers are more established than younger farmers, leading to better financial strength.
Summary
Data from the Illinois Farm Business Farm Management Association is used to examine one measure of farm liquidity, working capital to gross farm revenue. Data from 2012 to 2021 sorted by type of farm and by age of producer was used. Grain farms generally exhibited the strongest ratio over this time with the least variability. Beef and hog farms were more variable. Regarding the age of the operator, generally the older the operator the stronger the ratio. Both groups showed a decline until 2019 and has strengthened since then.
The author would like to acknowledge that data used in this study comes from the Illinois Farm Business Farm Management (FBFM) Association. Without Illinois FBFM, information as comprehensive and accurate as this would not be available for educational purposes. FBFM, which consists of 5,000+ farmers and 70 professional field staff, is a not-for-profit organization available to all farm operators in Illinois. FBFM field staff provide on-farm counsel along with recordkeeping, farm financial management, business entity planning and income tax management. For more information, please contact our office located on the campus of the University of Illinois in the Department of Agricultural and Consumer Economics at 217-333-8346 or visit the FBFM website at www.fbfm.org.
Source : illinois.edu