By Scott Irwin and Todd Hubbs
Department of Agricultural and Consumer Economics
University of Illinois
In a farmdoc daily article last week (April 16, 2020), we examined historical data on corn planting progress for three states in the heart of the U.S. Corn Belt—Illinois, Indiana, and Iowa—and showed that maximum planting rates per suitable field day increased very little over time and were not out of the ordinary in 2019. We argued that the results should be representative of other states and areas that produce corn given that the three states typically represent about a third of U.S. planted corn acreage. The purpose of today’s article is to expand the analysis of corn planting progress to 17 states that represent about 90 percent of the acreage planted to corn.
Analysis
We follow similar procedures as in our earlier analyses (farmdoc daily, April 19, 2018; April 17, 2019; April 16, 2020) of planting progress data reported in the USDA’s weekly Crop Progress report for Illinois, Indiana, and Iowa. We start by collecting data on the number of suitable field days each week that progress data is reported over 1995 through 2019 for each of the 17 states included in the weekly Crop Progress report. The 17 states represent an average of 89.4 percent of U.S planted corn acreage over 1995 through 2019. Data on suitable field days is not available on the USDA Quick Stats website before 1995, so we have fewer years to analyze than in our previous analyses of Illinois, Indiana, and Iowa, which started in 1980. Nonetheless, we still have observations for 25 years, which is adequate for the analysis conducted here. We also exclude Texas from the analysis because data on suitable field days is available only starting in 2014.
The next step in the analysis is to compute an acreage-weighted number of suitable field days each week and year for the 17 states. We do this by collecting data on the actual planted acreage for each of the 17 states each year and computing the planted acreage share for each state each year out of the total acreage for the 17 states. The acreage shares are used as the weights to compute the weighted-average suitable field days. These weights are the same for all weeks within a year.
We then measure planting progress per suitable field day for the 17 states by dividing total planting progress for the 17 states for a given week by the acre-weighted suitable field days for that same week. This standardizes for the varying number of days during a week that are suitable for planting. Some weeks may have large reported planting progress but this could be due to an unusually high number of suitable field days rather than a high rate of planting progress per day. Since planting progress is reported as the percentage of total acreage planted, we multiply the percentage progress by total planted acreage of corn in the 17 states in a given year to obtain planting progress in terms of acres.
Our initial interest is in the minimum number of days that it is possible to plant the corn crop in the 17 states, so we focus on weeks with the highest acreage planted per suitable field day. In other words, we want to know how fast the corn crop can be planted based on the highest rates of planting progress in the historical record. In addition, we average the progress per suitable field day for the two highest weeks each year in order to smooth out some outliers that appear in the single highest week each year.
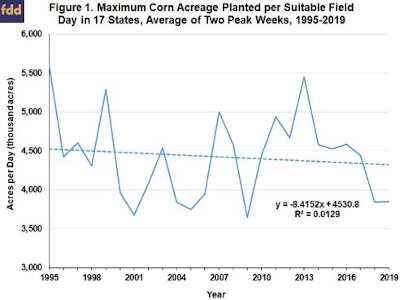
Figure 1 presents our estimates of the maximum corn acreage planted per suitable field day in the 17 states over 1995 through 2019. There is actually a slight downward trend over the sample period, but it does not appear to be very significant. The average for the 25-year sample period is 4.4 million acres per suitable field day. This confirms our previous findings that maximum planting rates per suitable field day in the U.S. have not increased over time and did not show historically unusual increases in 2019, when incentives to plant as rapidly as possible were present. This also indicates that investment in planting equipment during the last decade did not create extra capacity that could be called upon when conditions delayed planting substantially.
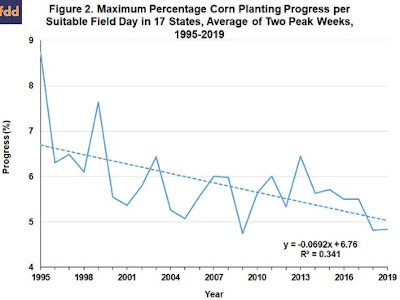
We next compute the maximum acreage planted per suitable field day as a percentage of total planted area in Figure 2. There is a pronounced downward trend when the maximum rate is expressed this way, with a decline from around 7 percent per suitable field day in the second half of the 1990s to about 5 percent in recent years. However, the average maximum percentage progress for the last 15 years has been relatively stable at around 5.5 percent per suitable field day. The overall downward trend shown in Figure 2 is due to the fact that the maximum acreage per suitable day was relatively flat at the same time that total acreage planted to corn in the 17 states increased about 22 million acres over the sample period. Planting capacity, at least in terms of maximum rates, did not increase as total planted acreage increased.
The next step of the analysis is compute the minimum number of days required to plant the corn crop in the 17 states. We do this by dividing total planted acreage of corn in the 17 states each year by the estimated maximum rate of corn planting progress per suitable field day shown in Figure 1. This provides an estimate of how fast the corn crop in the 17 states could be planted assuming the rate of daily planting is at the maximum per suitable field day. The computation also takes into account the changing total planted acreage of corn in the 17 states over time.
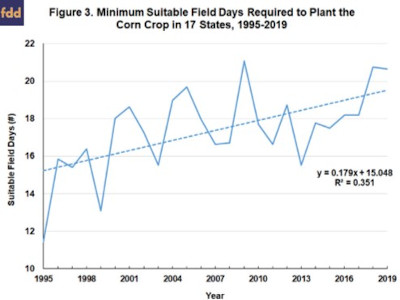
Figure 3 presents the estimated minimums for the 17 states over 1995 through 2019. There is a pronounced upward trend, with the minimum number of suitable field days generally ranging from 14 to 16 days in the second half of the 1990s to upwards of 18 to 20 days in the last decade. This is the mirror image of the trend shown in Figure 2. With a stable acreage rate per suitable field day and an expanding base of planted acreage, the percentage planted per suitable field day must fall and the number of suitable days needed to plant the crop must rise. It is interesting to note the contrast between these results and those presented earlier for Illinois, Indiana, and Iowa (farmdoc daily, April 19, 2018; April 17, 2019; April 16, 2020). We found a slight downtrend in the minimum number of days for Illinois and Indiana, from about 15 days in the early 1980s to about 14 days in recent years. The pattern for Iowa was different, with a notable decline through 2004 and a return in recent years to a similar number of days, about 14, as in the early 1980s. We concluded that it takes about 14 days, or two weeks, to plant the corn crop in each of the three states assuming maximum daily rates of planting progress. These conclusions do not uniformly hold for states outside of the heart of the Corn Belt.
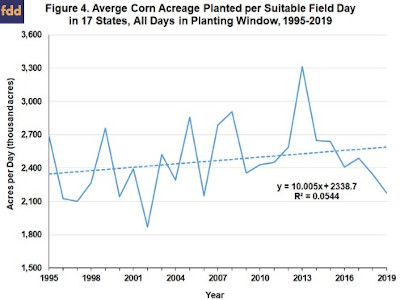
The results to this point have all been based on maximum rates of corn planting per suitable field day in order to assess the minimum number of days the U.S. corn crop might be planted. It is interesting to compare these maximums to the average rate computed across all weeks during the corn planting window. This is shown for the 17 states in Figure 4. In contrast to the maximum rate that showed a slight downward trend, the average rate for all suitable field days in a planting window shows a slight upward trend. But, still, the overall impression for the average rate is the same as for the maximum rate. That is, both are reasonably stable over time for the 17 states.
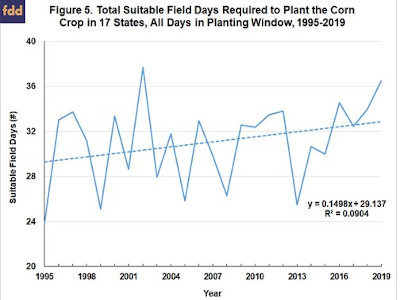
The last step of our analysis is to compute the actual number of suitable days in the 17 states to plant the corn crop each year. Here, we simply sum the weighted-average suitable field days starting with the first week that corn planting progress is reported in the Crop Progress report through the last week. The total “actual” number of suitable field days for the 17 states is shown in Figure 5. Once again, there is an increase in the total number of suitable field days over time, with about 29 days to plant the crop in the late 1990s increasing to around 33 days in recent years. The overall range of this measure is roughly 26 to 36 suitable field days. The upward trend in total suitable field days means that the time that it takes to actually plant the U.S. corn crop has increased about four suitable field days as the total size of U.S. corn acreage has increased over 20 million acres.
Implications
We examine historical data on planting progress for 17 states that represent nearly 90 percent of U.S. planted acreage of corn and show that there is a slight downward trend over 1995 through 2019 in terms of the maximum number of corn acres planted per suitable field day. The average for the 25-year sample period is 4.4 million acres per suitable field day. This confirms our previous finding (farmdoc daily, April 19, 2018; April 17, 2019; April 16, 2020) that bigger but fewer planters today plant about the same acres per day in aggregate as more numerous but smaller planters did in the past. Since total corn acreage in the 17 states increased by 22 million acres over 1995 through 2019, the stable maximum rate per day necessarily implies that the maximum percentage that can be planted per day declined and the minimum number of suitable field days needed to plant the crop increased. In recent years, the minimum number of suitable field days needed to plant the corn crop in the 17 states was about 19 days. This can be compared to the total number of field days that it actually took to plant the crop in the 17 states in recent years—about 33 suitable field days. The two measures bracket the time needed to plant the roughly 90 percent of the U.S. corn acreage found in the 17 states. If planting proceeds at the fastest possible rate the crop could be planted in 19 suitable field days, or about three weeks. In actuality, it usually takes 33 suitable field days, or about five weeks, to get the job done.
Source : illinois.edu