By Carl Zulauf
Department of Agricultural, Environmental and Development Economics
Ohio State University
Gary Schnitkey and Nick Paulson et.al
Department of Agricultural and Consumer Economics
University of Illinois
Smaller than expected South American soybean production, the Ukrainian-Russian War, and little-to-no expected increase in US principal crop acres in 2022 has created a tight supply-demand situation for grains and oilseeds for both the US and world. Given the current situation, the prevent plant provision in crop insurance is a potentially important acreage issue.
Prevent Plant Overview
Prevent plant is a provision in individual farm yield and revenue insurance contracts. Premiums for these contracts are subsidized by the US government. Specifically, if an insured cause of loss, such as excessive moisture, delays planting to or after a date set by USDA, RMA (US Department of Agriculture, Risk Management Agency), a farmer has the decision to (1) plant the planned crop, (2) not plant a crop and take a prevent plant payment, or (3) take a partial prevent plant payment and plant a crop with restrictions. This article focuses on the first two choices (see Data Note 1). Anecdotal evidence suggest they are the most common. They also are the starkest choices. Prevent plant is, in effect, a conditional land set aside decision for the farmer that is triggered when an insured cause of loss delays planting until a date set by RMA. The initial prevent plant date varies by region and crop, but for many spring planted crops occurs from late May through late June (for corn and soybean dates by areas see the May 3, 2022 farmdoc daily article by Schnitkey, et al.).
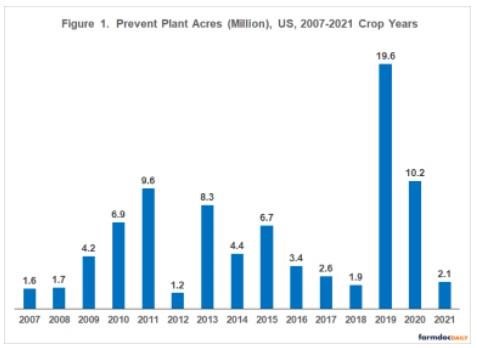
Prevent Plant – Historical Role
Prevent plant has averaged 5.6 million acres per year since 2007, the first year electronic data are available from USDA, FSA (US Department of Agriculture, Farm Service Agency) (see Figure 1 and Data Note 2). Given the role of weather, it is not surprising that the range is large: from 1.2 million acres in 2012 to 19.6 million acres in 2019. In USDA’s March 2022 acreage report, US farmers planned to plant 248.7 million acres to corn, cotton (both types), rice, sorghum, soybeans and wheat. These crops account for 99% of FSA prevent plant acres, with corn, wheat, and soybeans having individual shares of 44%, 24%, and 20%, respectively.
Prevent Plant in 2022
The top (black font) section of Table 1 is an estimate of the average prevent plant payment for 2022 Illinois corn and soybeans. They are $474 and $362 per acre, respectively, after subtracting $25 per acre for weed control on prevent plant acres. Data Note 3 contains a discussion of these calculations.
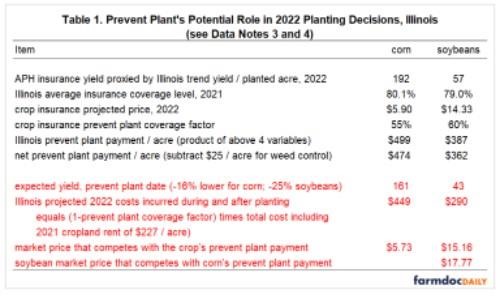
The bottom (red font) section of Table 1 is an estimate of the market price needed to break even with the prevent plant payment. Share of expenses incurred prior to planting is an important consideration. Conceptually, RMA’s prevent plant coverage factor equals this share (USDA, RMA, November 2018). Currently, RMA analysis has determined that 55% of corn and 60% of soybean expenses, including land, are incurred prior to planting. In other words, 45% of corn and 40% of soybean expenses, including land, are incurred during and after plating. The latter share of costs can be avoided by not planting but are incurred if the crop is planted. Using RMA’s shares and assuming expected yield is 16% lower for corn and 25% lower for soybeans than trend yield on the first prevent plant date, price would need to exceed $5.73 for corn and $15.16 for soybeans to provide a per acre return that exceeds the crop’s net prevent plant payment plus the costs incurred during and after planting. If market price on the first prevent plant date is close to current market prices and planting is delayed by an insured cause of loss, prevent plant would be a rationally competitive decision for soybeans but not corn. Data Note 4 contains a discussion of these estimates.
A crop’s prevent plant coverage factor is the same for all eligible acres of the crop. Prevent plant becomes more attractive if the share of expenses incurred prior to planting is lower than RMA’s prevent plant coverage factor (in other words, more costs are incurred during and after planting). The reason is that these costs can be avoided by not planting. When timely planting is more marginal and uncertain, it is managerially rational for farmers to minimize expenses incurred before planting even if prevent plant did not exist. It is thus not surprising that, since 2017, North and South Dakota account for 34% of US corn and soybean prevent plant acres but only 11% of US corn and soybean acres. In short, the share of expenses incurred during and after planting likely varies by area and, by extension, likely by farmer within an area.
Owned land that has no debt presents an interesting situation in this context. RMA treats 100% of land costs as incurred prior to planting (RMA, November 2018), but land owned with no debt has no cash cost except real estate taxes and insurance. Farmers may assign a residual value to this land after the crop is marketed, thus treating land as an expense occurred after planting. If land is assumed to be a cost incurred after planting, then the prevent plant coverage factors become 27% for corn and 22% for soybeans using data from RMA, November 2018. The breakeven prices become $7.46 for corn and $21.70 for soybeans. This discussion illustrates the importance of the prevent plant coverage factor. It also suggests that farmers may be more willing to take prevent plant on owned than rented land.
Cross Crop Prevent Plant for Soybeans and Corn
For an insured unit, acres eligible for a crop’s prevent plant payment are capped at the largest acres planted to the crop over the 4 preceding crop years minus acres planted to the crop in the current year. Corn and soybeans are often planted on an insured unit over a 4 year period, including alternative year planting on the entire unit. It is thus not uncommon that planting of soybeans is competing with the higher corn prevent plant payment. Given the data and assumptions in Table 1, soybean price would need to exceed $17.77 for a farmer to rationally prefer planting soybeans over taking the corn prevent plant payment. This price is 17% higher than the soybean price that competes with the soybean prevent plant payment. At current market prices, prevent plant is clearly competitive for land intended to be planted to soybeans and eligible for a prevent plant payment from corn. It is not surprising that corn accounted for 73% of corn plus soybean prevent plant acres during the 2017-2021 crop years. For a more in-depth discussion of the corn-soybean prevent plant interrelation during the 2019 crop year, see the farmdoc daily article of November 13, 2019 by Zulauf, Brown and Schnitkey. It is not clear that cross crop prevent plant was considered in setting the prevent plant coverage factor.
Prevent Plant and APH Insurance Yield
Under current prevent plant rules, no yield is recorded for a year if prevent plant is elected. In contrast, if a crop is planted, the farmer assumes the considerable risk that yield will be less than the APH yield. A lower yield can potentially impact APH for 10 years, the calculation window used for APH. In their study of the impact of crop insurance on input use, Mieno, Walters, and Fulginiti showed conceptually, and found empirically that farmers manage crop insurance decisions to minimize reductions in future APH yields and thus crop insurance’s future risk management value. To summarize, taking prevent plant avoids a potential 10 year cost of a lower APH if the crop is planted.
Prevent Plant, Consumers, and Public Policy
The preceding discussion focused on the design of prevent plant within crop insurance. A broader issue is whether prevent plant is appropriate public policy. Prevent plant makes production zero even though expected production is not zero. Not having this potential production in a year of tight supply-demand is to potentially impose a significant economic burden via higher prices on consumers of grains and oilseeds, which includes retail consumers, livestock producers, and ethanol producers in the US and across the globe. The poor are especially impacted. The US eliminated annual land set asides for commodity programs in the 1996 farm bill as the political process determined that their costs exceeded their benefits to US society (Orden, Paarlberg, and Roe, 1999; Coppess, 2018). The same public policy cost vs. benefit question exists for crop insurance’s prevent plant provision.
Summary Observations
Given the tight supply-demand situation for grains and oilseeds in 2022 and with prevent plant dates approaching and, in particular, occurring in late May in the northern US; the time is now to discuss this question:
Is crop insurance’s prevent plant provision appropriate public policy?
Analysis in this article finds significant economic incentive to take prevent plant if weather delays planting beyond the initial prevent plant date, especially for soybeans.
Expected production is not zero on the prevent plant date, but prevent plant makes it zero. While not all prevent plant acres would be planted if prevent plant did not exist, it is likely that some, maybe a lot, of prevent plant acres would be planted. Not having the potential production from land in prevent plant in a year of tight supply-demand is to potentially impose a notable economic burden on all consumers of grains and oilseeds, especially the poor. Should such an outcome occur, it could be considered a self-inflicted negative policy impact.
Data Notes
- The 3rd prevent plant choice has 2 possibilities: (1) 35% prevent plant payment (for example on corn) plus plant a crop (for example soybeans) or (2) full prevent plant payment plus plant a crop that cannot be harvested for grain but can be harvested for silage (for example, prevent plant on corn plus silage corn, silage oats, or other silage crop).
- USDA, FSA’s data on prevent plant and planted acres are internally consistent. USDA, RMA also reports prevent plant acres and USDA, NASS (National Agricultural Statistical Service) also reports planted acres. Farms are told to report the same acres to insurance and FSA, but not all farms are in commodity programs or buy insurance. In addition, FSA and RMA classify prevent plant acres somewhat differently while FSA and NASS use slightly different definitions of planted acres. For a more in-depth comparison, see USDA, Office of the Chief Economist, 2019.
- Prevent plant payment for a crop on an insured unit equals (APH insurance yield times coverage level times projected insurance price times prevent plant coverage factor). The projected price and prevent plant coverage factor are from RMA for the 2022 crop. Coverage level is the average level Illinois farmers purchased for individual farm and yield insurance in 2021. It is calculated from RMA data. APH insurance yield is the Illinois linear trend yield per planted acre for 2022 calculated using 1975-2021 crop year data from Quick Stats (USDA, NASS). Corn’s trendline equation has an intercept of 96.1 bushels / planted acre with a +1.99 bushel / planted acre annual increase in yield. R2 explanatory power is 67%. Soybean’s trendline equation has an intercept of 30.6 bushels / planted acre with a +0.54 bushel / planted acre annual increase in yield. R2 is 76%. Corn acres planted for grain equals total planted corn acres minus acres harvested for silage.
- Average total cost, excluding land, for the 4 regions reported in the Illinois Cost of Production Budget for 2022 is $771 per planted acre for corn and $498 per planted acre for soybeans. In 2021, average cash rent for Illinois cropland was $227 per acre. Total cost per planted acre is $998 for corn and $725 for soybeans. Land rents are likely higher in 2022, which would increase the breakeven price. The first prevent plant date for Illinois is June 5 for corn and June 15-20 for soybeans (May 3, 2022 farmdoc daily by Schnitkey, et al.) The declines in expected yield from trend yield for these dates are from the April 14, 2022 farmdoc daily article by Irwin.
Source : illinois.edu