By Krista Swanson, Jonathan Coppess, Gary Schnitkey
Department of Agricultural and Consumer Economics
University of Illinois
and
Carl Zulauf
Department of Agricultural, Environmental and Development Economics
Ohio State University
The 2018 Farm Bill provides landowners the opportunity to update program yields for the Price Loss Coverage (PLC) program and we recently examined the impact of crop rotation on the calculation for the option (
farmdoc daily, January 17, 2019). We discussed a concern that the formula does not address a fairness issue for farmers that use a crop rotation in which only one crop is planted to a Farm Service Agency (FSA) farm in a given year. Specifically, the formula further narrows the 5-year update window, magnifying the impact of both yield-increasing and yield-reducing events on the updated yield and very different potential payments may result. In this analysis, for a representative central Illinois case farm with a 50-50 rotation of corn and soybeans we find the average payment difference exceeds $3,000/year, on average with the only difference being the years in which corn and soybeans are planted in rotation.
Background
PLC is one of the safety net program options available to farmers, authorized in Title 1 of the 2018 Farm Bill. PLC provides fixed-price based income assistance. If triggered, payment calculations include a program yield; the difference between the reference price and marketing year average prices is multiplied by the program yield and 85% of the base acres for the payment amount. A provision in the 2018 Farm Bill provides farm owners with base acres for covered commodities a one-time opportunity to update PLC program yields. The formula includes two steps: (1) 90% of the average yield for the 2013 to 2017 crop years on the farm, excluding any crop year in which the crop was not planted; and (2) reduced by a ratio that compares the 2013 to 2017 national average yields per planted acre to the 2008 to 2012 national average yields, limited to a range of 0.9 to 1.0. Table 1 provides an initial estimate of the expected yield update formula for corn and soybeans (
farmdoc daily, December 12, 2018).
The land owner will want to choose the highest yield to maximize payments. In some cases, the calculated yield will be lower than the existing program yield and the land owner will opt to retain the existing program yield. In other cases, the calculated yield will exceed the existing program yield and the land owner will opt to utilize the yield update. This is a similar decision to that which landowners made for previous optional updates, including 2014. The 2014 yield update formula was: (90% times average 2008-2012 yield per planted acre of a covered commodity on a FSA farm) (
farmdoc daily,
January 17, 2019).
Historically, when a provision in the Farm Bill provides the option for a yield update, the window for calculating the yield update has been either four or five years. Use of a small window amplifies the impact of yield altering weather events on the updated yield. The drawback to using a small set of years is also augmented by a crop rotation on an individual FSA farm; rotation means there are even fewer years within the already small window with yields for a particular crop to calculate in the average. For example, if a two-crop rotation such as corn and soybeans is used and only one crop is planted in a given year on an individual FSA farm, then the 5-year update window would only have two years of yields for one crop and three years of yields for the other crop.
Analysis
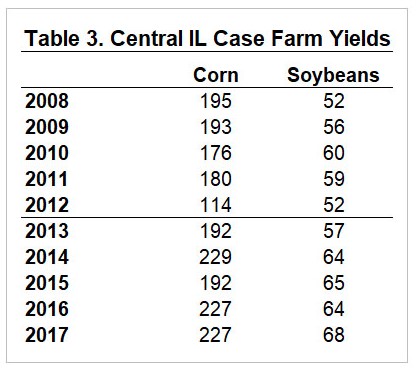
As an example, a central Illinois case farm, located in McLean County, with 1,700 acres split evenly between corn and soybeans is created using averages of actual FBFM data for central Illinois farms with 1,500-2,000 acres. Financial and tenure characteristics of the farm are based on actual farm data. A farm of this size will likely include several individual FSA farms. A farmer using a 50-50 corn-soybean rotation may plant each individual FSA farm to half corn and half soybeans each year, or divide the corn and soybeans acres over total farmed land and plant all corn on some FSA farms and all soybeans on other FSA farms each year.
The yield update will be evaluated separately for each FSA farm, comparing actual yields from 2013-2017 on that specific piece of land to U.S. yields. In some cases, farmers will not have yields for a given crop on an individual FSA farm for all five years and the yield update will be calculated using only the years in which yield data for the crop is available for the FSA farm. The farm yields are an average of actual yields reported annually on McLean County farms enrolled in Illinois FBFM.
For the 2008-2012 update window used by the 2014 Farm Bill, and assuming both crops are planted each year on the farm, the 2014 Farm Bill payment yield will be 154.3 bu/acre for corn and 50.2 bu/acre for soybeans. For purposes of this example, we assume the existing PLC yield is the 2014 Farm Bill yield update. With that assumption, these yields are carried forward if the farmer does not elect to update the program yield. If corn and soybeans are planted on the FSA farm in all years, the 2018 farm bill yield update will be 172.8 for corn bu/acre and 51.6 bu/acre for soybeans, as shown in Table 2.
If the FSA farm was on a rotation of corn and soybeans beginning with corn in 2008, the calculated yield update would be 184.9 bu/acre for corn and 51.5 bu/acre for soybeans. If the FSA farm was on a rotation of corn and soybeans beginning with soybeans in 2008, the calculated yield update would be 164.7 bu/acre for corn and 51.9 bu/acre for soybeans.
Looking at the 2018 Farm Bill update period from 2008, the impact of the 2012 drought on the 2014 farm bill corn update yield is clear. In addition, the rotation with corn in the drought year benefited from having corn in the two highest years during the 2018 farm bill update window: 2014, 2016. In contrast, the rotation without corn during the 2012 drought had corn in the 2 lowest years during the 2018 farm bill update window: 2013 and 2015. Although soybean yields were lower in 2013 than the other four years, there was less variation in soybeans yields over the five-year period so the averages have less variability than corn.
For corn, the new PLC yield update formula is to the landowner’s advantage if corn and soybeans were planted in all year of if the farm was on a rotation with corn in 2008. For a rotation with soybeans in 2008, it would be to the landowner’s advantage to retain the yield update calculated under the 2014 Farm Bill. For soybeans, the new PLC yield update formula is to the landowner’s advantage if corn and soybeans were planted in all years or if the farm was on a rotation with soybeans in 2008. For a rotation with corn in 2008, it would be to the landowner’s advantage to retain the yield update calculated under the 2014 Farm Bill. The selection with the advantage will vary between FSA farms depending on which years corn and soybeans were planted on the farm.
Evaluating Policy Changes
The Gardner Farm Income and Policy Simulator (GFIPS) is used to evaluate the farm level impact of policy changes to the PLC program yield update formula. All starting variables and all other projection period variables are held constant. With 2017 as the model base year, PLC payments are estimated for the case farm for the 2018 through 2022 crop years under 10,000 different price and yield sets for the model’s five-year forecast period. Although 2018 Farm Bill policy will be implemented beginning with the 2019 crop, the one-time option for yield update will not take effect until the 2020 crop. Therefore, results are shown for 2020 through 2022.
In this analysis we compare PLC payments under three scenarios, corn and soybeans planted in all years, a corn and soybean rotation beginning with corn in 2008, and a corn and soybean rotation beginning with soybeans in 2008.
Impact of Policy Changes on PLC Payments
The incidence of a payment depends on the relationship between marketing year average (MYA) price and the reference price, shown in Table 4, not the payment yield. Therefore, the number of instances triggering a PLC payment is the same for all scenarios in a given year. Although program yield is not a factor in occurrence of payment, as a multiplier in the payment calculation, it does influence payment amount.
For corn, the highest rotational PLC yield is 10.3% higher than the lowest rotational PLC yield. For soybeans, the highest rotational PLC yield is 0.5% higher than the lowest rotational PLC yield. With PLC yield as a multiplier in the payment calculation, rotation has a greater impact on the calculation of corn payments than soybean payments, and the variation between highest and lowest per acre payments for each commodity is equivalent to the variation in yield, 10.3% for corn and 0.5% for soybeans.
The average PLC corn payment in 2020 is $56.21/acre for a rotation with corn in 2008 and $50.95/acre for a rotation with soybeans in 2008. Only 50% of instances are triggering a payment in 2020. The average PLC corn payment for instances that trigger a payment in 2020 is $111.54/acre for a rotation with corn in 2008 and $101.11/acre for a rotation with soybeans in 2008. Across all three years, the average PLC corn payment for instances that trigger a payment is more than $10/acre higher with the rotation having corn in 2008, rather than soybeans in 2008. When corn and soybeans are planted in all years, the average PLC corn payment is between the average payments of the two rotations. Average per acre PLC corn payments are shown in Table 4.
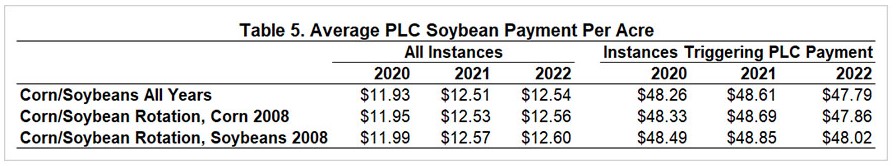
The average PLC soybean payment in 2020 is $11.95/acre for a rotation with corn in 2008 and $11.99 for a rotation beginning with soybeans in 2008. Only 25% of instances are triggering a payment in 2020. The average PLC soybean payment for instances that trigger a payment in 2020 is $48.33 for a rotation with corn in 2008 and $48.49 for a rotation with soybeans in 2008. Average per acre PLC soybean payments for all instances and instances that trigger a soybean PLC payment are shown in Table 5. The differences across the averages for instances that trigger a payment is less than $0.30/acre from highest to lowest, regardless of rotation.
The per acre payments are made on 85% of the base acres on the farm and the total PLC payment a person or legal entity can receive for the sum of all covered commodities, with the exception of peanuts, is $125,000. With this limit on total PLC payment imposed, the average total payment will not have the same percent variability as yield or the per acre payments. For this analysis we assume that base acres are evenly divided between corn and soybeans.
In each year from 2020 to 2022, this owner received the largest average payment if a corn and soybean rotation beginning with corn in 2008 was planted on the farm and the smallest average payment if a corn and soybean rotation beginning with soybeans in 2008 was planted on the farm.
Of instances triggering a payment that did not reach the maximum payment threshold, in approximately 90% of instances in all three years the total farm payment was higher when a corn and soybean rotation had corn in 2008 versus soybeans in 2008 (90% in 2020, 91% in 2021, 89% in 2022). This leaves approximately 10% of instances having a higher total farm payment on rotations that had soybeans in 2008.
The average PLC payment by year for all instances and for instances triggering a payment is shown in Table 6. The total payment for instances triggering a payment is more than $3,000 higher, on average, when a corn and soybean rotation had corn in 2008 compared to soybeans in 2008. This advantage extended more than $11,000 under some price and yield scenarios each year. As a comparison, in the approximately 10% of instances that had soybeans in 2008 and a higher total farm payment, the largest advantage recorded was under $300 in all three years.
Summary
This analysis illustrates how the PLC program yield update formula is heavily reactive to variation in yields over a short window of time. It demonstrates how crop rotation further narrows the update window and magnifies the impact of yield altering events on updated yield. The average payment difference across alternative corn-soybean rotations exceeds $3,000/year, on average, for a representative central Illinois farm when PLC payments were triggered. Some 2020 through 2022 price and yield scenarios show a more considerable rotational advantage with PLC payment more than $11,000 depending on which years a farm had corn or soybeans planted in the rotation. This high payment difference was observed in a low price year during which government program payments may have a disproportionately large impact on farm profitability and perhaps even survivability of the farm if it is highly leveraged. Because the case farm had considerable variation in corn yields throughout the update window from 2013 through 2017, and very little variation in soybean yields in the same period, the crop rotation had a large impact on corn payments but little impact on soybean payments. On a given farm, any crop could fall into either scenario.