By Carl Zulauf
Department of Agricultural, Environmental and Development Economics
Ohio State University
The most common US view is that an era of crop prosperity ended in 2013. In contrast, trends outside the US suggest crop farming in the rest of the world (ROW) remained in an era of growth, particularly for feed grains and oilseeds. Throughout the 21st Century US growth has lagged behind ROW growth and is likely the reason for the recent struggles of the US farm sector.
Procedures and Data: Trends are tracked for feed grains, oilseeds, and food grains using USDA’s (US Department of Agriculture) Production, Supply, and Distribution data base (see Note 1). Examining only corn and soybeans overstates trends by ignoring corn’s increasing share of the feed grain market and soybeans increasing share of the oilseed market.
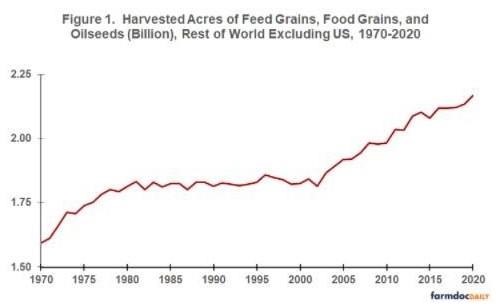
ROW Harvested Acres: Continued growth in acres implies production is profitable enough to encourage expansion. During the 1970-1980 period of prosperity total acres of feed grains, oilseeds, and food grains harvested outside the US increased on average by 26.9 million per year (see Figure 1). Since 2003, acres have increased on average by 17.8 million per year (see Note 2). Acres changed little between 1980 and 2003. Consistent with the increase in ROW acres during the 21st Century, Langemeir and Purdy found that returns to producing corn and soybeans over 2013-2017 were more likely to have covered or exceeded total cost of production for typical farms located in Argentina, Brazil, Russia, and the Ukraine than in the US.
ROW (Rest of World) Use: ROW imports all 3 categories of crops from the US. Thus, ROW use of these crops is their domestic consumption of the crops. Consumption of food grains by ROW has increased consistently since 1970 with no obvious change in its rate of growth (see Figure 2).
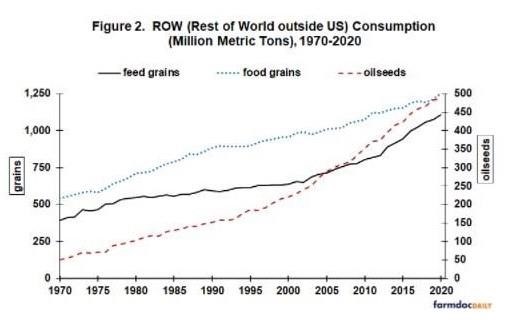
Growth in consumption of oilseeds by ROW changed in the mid-1990s, which coincides with China’s emergence as an oilseed importer. ROW consumption of oilseeds grew on average by 5.5 MMT (million metric tons) per year between 1970 and 1995, increasing to 12.7 MMT per year from 1995 through 2020.
After slow growth from 1980 through 2000, growth in ROW consumption of feed grains turned higher in the early 2000s, moving even higher after 2010. Average increase per year was 15.4 MMT over 1970-1980, 4.4 MMT over 1980-2000, 16.7 MMT over 2000-2010, and 30.3 MMT over 2010-2020. Last, growth in consumption of all 3 crop categories shows no obvious sign of slowing after 2013.
US Use: Use of US produced crops equals domestic US consumption plus US exports. For US produced food grains, use has not grown since 1980 (see Figure 3): Projected use of 68 MMT for 2020 is nearly identical to the 65 MMT used in 1980.
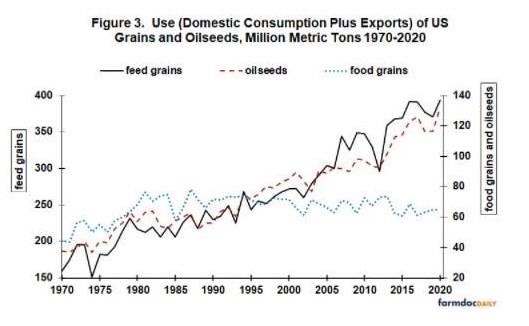
Like ROW, use of US oilseeds increased after China began importing oilseeds in 1995. Average growth per year increased from 1.4 MMT over 1970-1995 to 2.4 MMT over 1995-2020. While growth in use of US oilseeds increased a nontrivial 78% (2.4/1.4 – 1), it was less than the 133% (12.7/5.5 – 1) increase in the growth of ROW oilseeds.
Using the same periods to facilitate comparison of the US and ROW, average growth per year in US use of feed grains was 5.8 MMT over 1970-1980, 2.7 MMT over 1980-2000, 7.6 MMT over 2000-2010, and 4.6 MMT over 2010-2020. Annual growth In US feed grain use was 40% smaller over 2010-2020 than 2000-2010 (4.6/7.6 -1). The comparable calculation for ROW is 80% higher growth (30.3/16.7-1). Growth in US feed grain use was slower over 2010-2020 than 2000-2010 despite a large increase in US feed grain exports from 50.5 MMT in 2010 to 78.5 MMT in 2020 (current projection). If realized, 2020 feed grain exports will break the 1979 US record of 70.6 MMT. Offsetting the growth in exports was a nontrivial slowing in US ethanol production. Corn processed into ethanol grew from 0.6 to 5.0 billion bushels between 2000 and 2010, with the most since being 5.6 billion bushels in 2017.
Assessment
Agriculture outside the US appears to be in a sustained period of prosperity dating to the early 2000s.
Oilseeds and feed grains are driving this prosperity.
During the 21st Century, growth in grain and oilseed use has been notably slower in the US than ROW. Lower US growth is likely a key factor in the financial struggles of the US field crop sector since 2013.
US field crops will likely depend on exports for economic wellness unless new domestic uses emerge.
But, is the large increase in US exports, especially of feed grains, in 2020 and 2021 and the large run up in prices a permanent reconnection of the US crop sector with the underlying demand strength in ROW or a temporary reconnection reflecting a short term supply-demand imbalance in ROW? This is literally a billion $ question for US agriculture.
History suggests caution. Limited to no growth in US grain exports since the 1980 partial US embargo on wheat and corn exports to the USSR for its invasion of Afghanistan (see July 13, 2018 farmdoc daily) is consistent with a reluctance to become dependent on US exports. Other factors include the transition of emerging middle income per capita economies from taxing to supporting agriculture (see Anderson) and market incentives to expand production, such as by increasing acres (see Figure 1).
Growth in RWO harvested acres is also a climate change issue. Is it reasonable or even possible to pull land out of agriculture or reduce its intensity of cultivation when economic incentives are to expand land in cultivation? Failure to take current market incentives into account in designing climate change policy runs the risk of spending large amounts of money that may end up accomplishing little or even being detrimental.
Notes
- Feed grains are barley, corn, millet, oats, and sorghum. Oilseeds are copra, cottonseed, palm kernel, rapeseed, soybeans, and sunflower seed. Food grains are rice, rye, and wheat.
- US harvested feed grain, oilseed, and food grain acres of 226 million in 2020 are nearly identical to the 229 million acres harvested in 1973. Few land retirement programs were in effect in 1973 in response to the price run-up that started the 1970 period of prosperity.
Source : illinois.edu