By Scott Irwin
Department of Agricultural and Consumer Economics
University of Illinois
The market impact of small refinery exemptions (SREs) granted under the RFS remains a highly contentious issue. From a regulatory standpoint, there is no doubt that SREs opened a backdoor mechanism for the EPA to reduce the statutorily-mandated RFS volumes (farmdoc daily,
July 12, 2018). However, there is sharp disagreement about the impact of SREs on the physical consumption of biofuels, particularly for ethanol. The ethanol industry has argued vociferously that there has been substantial destruction of demand in the physical ethanol market due to the SREs. However, a series of farmdoc daily articles in recent months showed that the physical use of ethanol declined little if any due to SREs (
September 13, 2018;
December 13, 2018;
January 16, 2019). This is not really all that surprising because ethanol prices generally have been low relative to gasoline, which means that ethanol is a price competitive component in E10 gasoline blends and the RFS conventional ethanol mandate is non-binding (up to the E10 blend wall). The situation is much different for biomass-based diesel (BBD), because BBD prices are substantially higher than diesel prices, and consequently, the BBD mandate is highly binding. In this case, the demand for biomass-based diesel in the physical market should be reduced by SREs. The purpose of this article is to investigate the magnitude of BBD demand destruction in the physical market due to SREs.
Analysis
It is helpful to begin the analysis by reviewing an economic model of the BBD market (biodiesel and renewable diesel) with RFS volume mandates. It is the same economic model that has been used, in one form or another, in a number of earlier articles on the RFS and RIN pricing (e.g., farmdoc daily,
April 5, 2017;
August 23, 2017). The model shown in Figure 1 represents the supply of BBD producers and demand from diesel blenders at the wholesale level in a competitive market. It is important to note that supply represents the total of domestic and imported production. Retail demand at the consumer level is implicitly represented by a simple percentage markup of the wholesale demand shown in Figure 1. This implies full pass-through of wholesale price changes to the retail level. The model assumes L-shaped demand curves, with the vertical and perfectly inelastic portion equal to the fixed RFS volume mandate and the horizontal perfectly elastic portion above the mandate equal to ultra low sulfur diesel (ULSD) prices. This reflects an assumption that BBD and petroleum diesel are perfect substitutes after adjustment for the lower energy value of most BBD.
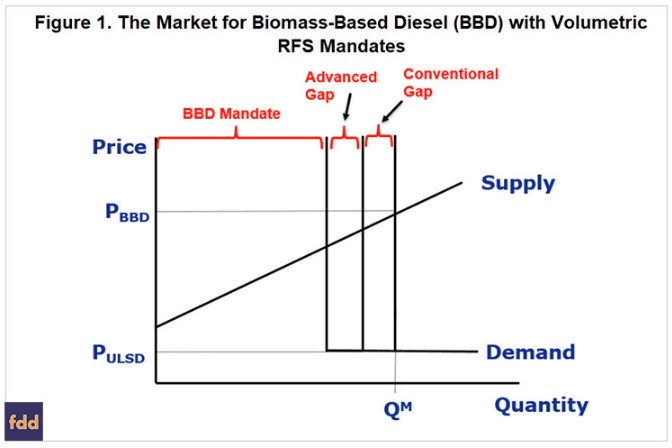
A key insight provided by the model shown in Figure 1 is that BBD fills three “buckets” in the RFS. The first bucket is the BBD mandate itself, which is represented by the vertical demand segment furthest to the left in the figure. The second bucket is the advanced gap, which reflects an assumption that BBD is the marginal gallon for filling the gap between the total advanced mandate and the BBD mandate. This gap is represented by the increment between the leftmost and middle vertical demand segments in the figure. The third bucket is the conventional gap, which reflects the assumption that BBD is the marginal gallon for filling the gap between the conventional ethanol mandate and the E10 blend wall. This gap is represented by the increment between the middle and rightmost vertical demand segments in the figure.
Under the model assumptions, the total “effective” BBD mandate in Figure 1 is the sum of the BBD mandate, advanced gap, and conventional gap and the total demand for BBD is represented by the L-shaped demand curve furthest to the right in the figure. As usual, equilibrium is found where the supply and demand curves intersect, which is the point (PBBD, QM). Since the mandated total BBD quantity (QM) substantially exceeds the amount of BBD that would be produced in the U.S. absent the mandate (zero), the mandate is said to be binding. In order to incentivize the higher production, BBD producers must be paid a price that is higher (PBBD) than the diesel price (PULSD).
A key assumption of the model in Figure 1 is that BBD is the marginal (cheapest) biofuel for filling the advanced and conventional gaps. There is substantial evidence that these are reasonable assumptions. First, very limited quantities of other advanced biofuels (e.g. cellulosic ethanol, sugarcane ethanol from Brazil) have been consumed in recent years, leaving the vast majority of the advanced gap to be filled by BBD (e.g., farmdoc daily,
July 17, 2017). Second, in a similar fashion, consumption of higher ethanol blends, such as E15 and E85, has been very limited, meaning that BBD has been the biofuel of choice by obligated parties to fill the conventional gap (e.g., farmdoc daily,
July 19, 2017). Third, the behavior of RIN prices has generally been consistent with BBD being the marginal gallon to fill both the advanced and conventional gaps. When BBD is the marginal gallon the price of D4 biodiesel, D5 advanced, and D6 ethanol RINs are all the same. This has generally characterized actual RIN prices much of the time since 2013 (e.g.,
July 19, 2013;
December 4, 2015). The only exceptions have occurred when the RIN market expected policy changes to erase the conventional gap.
With this background we can turn to estimating the magnitude of BBD demand destruction due to SREs. The first task is to estimate what BBD demand would have been in the absence of SREs. Since the total BBD mandate has always been highly binding, this is the same thing as estimating the BBD mandate, the advanced gap, and the conventional gap before the impact of SREs. This is not as difficult as it may sound. The specific steps are as follows:
- Estimate total gasoline and diesel consumption for the U.S. using the same adjustments as the EPA makes in its annual rulemakings. The estimates of total gasoline and diesel consumption are drawn from the February 2019 STEO from the EIA.
- Multiply total gasoline and diesel consumption by the annual percentage standards for BBD, total advanced, cellulosic, and total renewable to estimate the final annual mandates in gallons.
- Estimate the advanced mandate gap as the difference between the total advanced and BBD mandates from #2 after adjusting for use of other advanced biofuels (e.g., cellulosic ethanol and biogas, advanced ethanol)
- Estimate the conventional gap as the difference between total domestic disappearance of ethanol and the conventional mandate from #2 after adjusting for advanced ethanol use.
The next task is to estimate BBD demand after consideration of the SREs. The steps are exactly the same as above except the total exempted volume associated with SREs is subtracted from the EIA STEO estimates of gasoline and diesel consumption. These are reported by the EPA in Table 1 found
here. The SRE exempted volumes used in this analysis were last updated on March 14, 2019, the most recently available. The total exempted volume of gasoline and diesel increases from 1.98 billion gallons in 2014 to 17.03 billion gallons in 2017. The EPA also reports total obligated gasoline and diesel volumes on an annual basis
here, and these totals should directly reflect the volumes exempted via SREs. Unfortunately, this data has not been updated since last October and it is not clear the degree to which the data actually reflect exempted volumes due to SREs. For this reason, the EPA reported data on total obligated gasoline and diesel volume is not used in the analysis. Instead, we start with the EIA STEO estimates of gasoline and diesel use and then subtract the SRE exempted volumes from these totals. This assures that the same base of total gasoline and diesel volumes is used in the pre- and post-SRE scenarios.
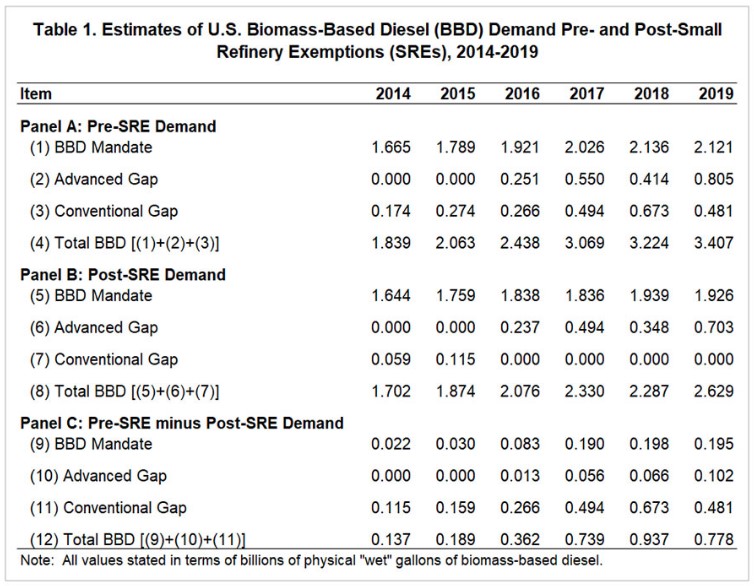
The estimates of BBD demand pre- and post-SREs using the above procedures for 2014 through 2019 are presented in Table 1. The pre-SRE estimates in Panel A show that the BBD mandate increases from 1.665 billion gallons in 2014 to a projected 2.121 billion gallons in 2019. The advanced gap pre-SRE was zero in 2014 and 2015, but grew rapidly as the total advanced mandate increased more quickly than the BBD mandate. The advanced gap under this scenario is projected to reach 805 million gallons in 2019. The conventional gap is estimated to start at 174 million gallons in 2014, rise to a peak of 673 million gallons in 2018, and decline to 481 million gallons in 2019. After summing the three components, total BBD demand pre-SRE increases sharply from 1.839 billion gallons in 2014 to a projected 3.407 billion gallons in 2019, an increase of 1.567 billion gallons or 85 percent. Notice that the bulk of the increase in total BBD demand is due to growth in the advanced and conventional gaps rather than growth in the BBD mandate itself. Finally, the total BBD demand estimates for the pre-SRE scenario are very similar to estimates made in previous farmdoc daily articles (e.g., farmdoc daily,
July 19, 2017), which is not surprising since the procedures and underlying data are quite similar.
The post-SRE BBD demand estimates are found in Panel B of Table 1. Again, the only change in data and procedures for the post-SRE scenario is exempted volumes due to SREs are subtracted from total gasoline and diesel use. Since the data on exempted volumes are only available through 2017 at the present time, it is assumed that exempted volumes are the same in 2018 and 2019 as in 2017. This seems like a reasonable assumption given that the number of SREs awarded or under consideration for 2017 (37) is very close to the number of SRE petitions under consideration by the EPA for 2018 (39). It makes sense that the pool of firms seeking SREs does not change greatly from year-to-year. Regardless, it should be kept in mind that SRE volumes are projected for 2018 and 2019.
As expected, the post-SRE estimates in Panel B of Table 1 show across the board declines in the components of BBD demand. This is a direct function of the SREs reducing the base of total gasoline and diesel use and fixed percentage mandates. Of particular note is the disappearance of the conventional gap from 2016 forward. This is a result of SREs pushing the conventional ethanol mandate back below the E10 blend wall, a point that has been highlighted in previous farmdoc daily articles (e.g.,
July 12, 2018) as one of the main ways that SREs impact RFS compliance. This can be seen even more directly in Panel C of Table 1, which shows the difference in BBD demand pre- and post-SRE. BBD demand is estimated to decline a total of 3.143 billion gallons over the six years due to SREs and 2.187 billion gallons, or 70 percent, is due to the decline in the conventional gap. The size of the annual declines in total BBD demand is also noteworthy, approaching a billion gallons in 2018 and exceeding 700 million gallons in 2017 and 2019. For comparison, U.S. domestic production of biodiesel was 1.854 billion gallons in 2018.
The previous exercise indicates that SREs have wreaked considerable demand destruction on BBD. However, we cannot use the estimates in Table 1 without taking into consideration the fact that all SREs are granted retroactively. This seems to imply that SREs could not have the impacts estimated in Table 1 because the SREs are granted in an after the fact manner, which would make the entire exercise a moot point. While appealing on the surface, this logic is incorrect because of the role of expectations. Specifically, expectation of SREs being granted in a serial fashion can change the market behavior of obligated parties under the RFS. In other words, if an obligated party receives an SRE in year 1 and expects to receive another SRE in year 2 this will affect the obligated party’s market behavior in year 1, even though the SREs are awarded retrospectively.
Unfortunately, we do not know the exact timing when SREs have been awarded because this is considered proprietary information by the EPA. But we do know that there was a dramatic change in the policy regarding SREs with the changeover from the Obama to the Trump administration after the 2016 election. Figure 2 provides important evidence that this was indeed the case. The figure compares monthly BBD RIN generation (annualized) compared to the total BBD demand pre-SRE (annual/12) over January 2014 through January 2019. BBD RIN generation is the sum of D4 biodiesel RIN generation and imported/foreign-generated D6 ethanol RIN generation. The latter is well-known to represent imported biodiesel that does not qualify for a D4 RIN (e.g., farmdoc daily,
July 19, 2017). From 2014 through 2016 there was a clear pattern of obligated parties incentivizing BBD RIN generation well above the total BBD demand pre-SRE, which indicates it was highly unlikely that the expectation of SREs being awarded in the future affected the market behavior of obligated parties during this period. Some of the RIN generation above pre-SRE demand before 2017 can be explained by the expiration of the biodiesel tax credit at the end of 2016 and concerns about imposition of duties on BBD imports, but certainly not all of it. There was a marked change in the pattern during 2017 and 2018, with BBD RIN generation near or well-below pre-SRE BBD demand. This provides strong evidence that the expectation of future SREs changed the market behavior of obligated parties starting in 2017.
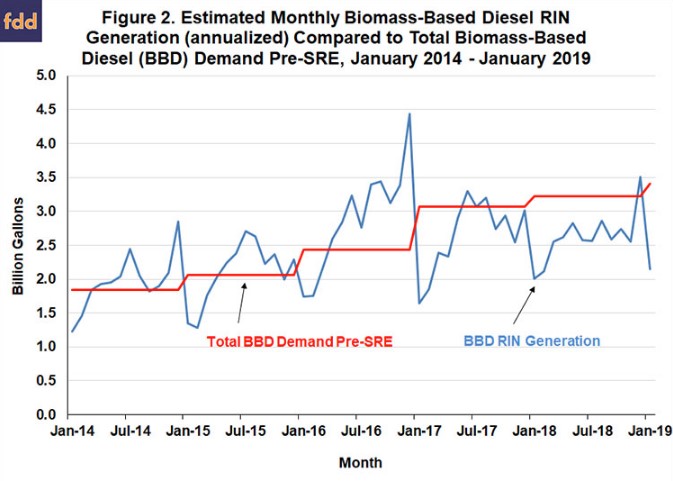
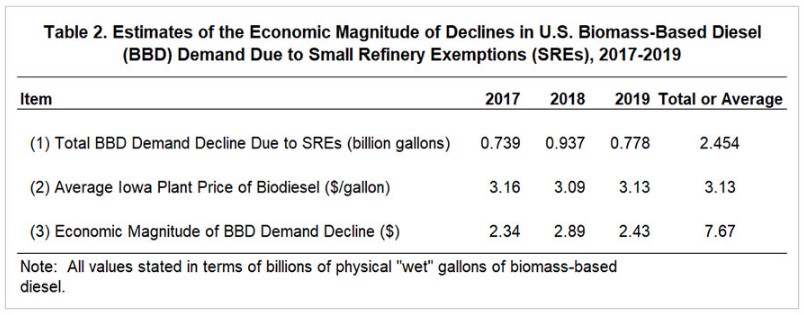
The evidence from Figure 2 implies that the estimates of BBD demand decline in Table 2 before 2017 are best thought of as “nominal” and “after the fact.” In other words, the SREs impacted final compliance with the RFS mandates but not physical market demand because SREs for 2014-2016 were awarded too far after the fact to have impacted the market behavior of obligated parties in real-time. However, the evidence from Figure 2 suggests that BBD demand decline estimates in Table 2 for 2017-2019 are valid because the expectation of future SREs had a notable real-time impact on the market behavior of obligated parties. Based on this logic, the economic magnitude of the decline in BBD demand due to SREs for 2017-2019 is computed in Table 2. The total BBD demand decline for each year is drawn directly from Table 1 and the average annual BBD price is proxied by the Iowa plant price of biodiesel. The 2019 estimate of the plant price is simply the average price for 2017 and 2018. The economic magnitude is computed as the demand decline volume times the average price. The estimates of the economic magnitude of losses exceed $2 billion each year and total $7.67 billion across the three years. This is a large economic loss to the global BBD industry by any standard. It should also be pointed out that these estimates are likely conservative because we did not take into account any increase in the BBD price that would be required to incentivize production of the lost volumes.
Implications
Most of the controversy surrounding small refiner exemptions (SREs) granted under the RFS center on the demand for ethanol. However, from the beginning it was unlikely that demand destruction in the ethanol market due to SREs would be very significant because ethanol is a price competitive component in E10 gasoline blends, and therefore, the vast majority of ethanol demand is not dependent on the RFS mandate. The story for biomass-based diesel (biodiesel and renewable diesel) is very different, with demand entirely dependent on the RFS mandate. In this article, the demand for biomass-based diesel (BBD) pre- and post-SREs is estimated. The results indicate that, as expected, SREs have wreaked considerable demand destruction on BBD. Specifically, BBD demand is estimated to be reduced a total of 2.5 billion gallons over 2016-2019 due to SREs. The size of the annual declines in total BBD demand is also noteworthy, approaching a billion gallons in 2018 and exceeding 700 million gallons in 2017 and 2019. By comparison, U.S. domestic production of biodiesel was 1.9 billion gallons in 2018. Estimates of the economic magnitude of the losses exceed $2 billion each year and total $7.7 billion across the three years. This is a large economic loss to the global BBD industry by any standard. An interesting question is how these losses have been distributed across U.S. and foreign BBD producers.