By Carl Zulauf
Department of Agricultural, Environmental and Development Economics
Ohio State University
Gary Schnitkey, Krista Swanson, and Nick Paulson
Department of Agricultural and Consumer Economics
University of Illinois
Stocks are an important market variable. They reflect the balance between supply and demand. High stocks generally mean low prices, and vice versa. US policy toward stocks has changed over time, culminating in the 1996 farm bill eliminating most public stock programs. Reflecting policy changes, the ratio of US corn, soybean, and wheat stocks to use have declined since 1960. Despite holding notably fewer stocks relative to use, the variability of US domestic use, exports, and crop year prices have not increased in general.
Stock-to-Use Ratio
Stocks are inventories at a point in time. USDA (US Department of Agriculture) reports stocks of field crops as of March 1, June 1, September 1, and December 1. In addition, WASDE (World Supply and Demand Estimates) contains monthly estimates of stocks at the end of the marketing year, which is the end of August for corn and soybeans. Ending stocks of corn and soybeans for the 2020-21 marketing year are currently estimated at 1,107 and 135 million bushels, respectively. Currently, most US stocks of field crops are held by farmers, elevators, and processors.
A primary function of stocks is to smooth use of a product over time. They perform this function by transporting supplies from years of larger production to years of smaller production. Stocks are usually expressed as a ratio to use during the marketing year. Focusing on corn, uses include feed, food, ethanol, and other industrial products. Total use for 2020-21 is currently estimated at 15,020 million bushels, giving a stock-to-use ratio of 7.4% (1,107 stocks / 15,020 use). Some ending stocks are needed each year to satisfy use until the new harvest becomes available. High stock-to-use ratios indicate that more supply is available, generally leading to lower prices. Conversely, low stock-to-use ratios indicate a tight supply situation and higher prices.
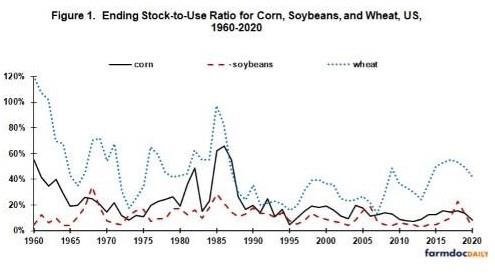
Consistent with a function of smoothing use, US ending stocks of corn, soybeans, and wheat relative to marketing year use vary from year to year (see Figure 1). Use includes domestic use and exports. Stock and use data are from USDA’s Production, Supply, and Distribution (PSD) data base. PSD does not contain US soybean data for 1960-1963. They are from USDA’s 1972 Agricultural Statistics.
Brief History – US Farm Stock Policy
Stocks of farm commodities held by US government agencies were an important farm policy tool beginning with the New Deal farm programs of the 1930s and continuing through the early 1970s when a surge in world demand eliminated most public stocks. Sizable public stocks reappeared in the early 1980s as the export boom faded. The high cost of public stocks prompted Congress to substantially reduce US farm program price floors in the 1985 farm bill in an attempt to spur use. The ensuing increase in use combined with the severe drought of 1988 largely eliminated public stocks. Long term retirement of land from production via the Conservation Reserve Program, also initiated in the 1985 farm bill, helped keep public stocks from re-emerging. In the 1996 farm bill, Congress eliminated most public stock programs as well as annual land set asides, a production reserve program. Since 1996, almost all US stocks have been held by private storage agents, in particular farmers, elevators, and processors.
Stock-to-Use Ratio by Public Stock Period
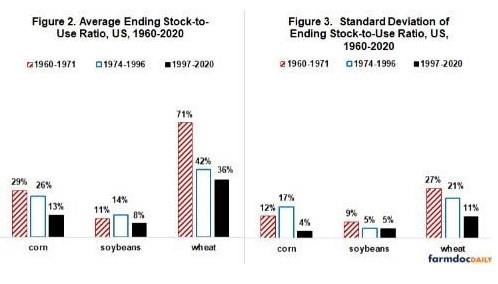
Average stock-to-use ratio was calculated for 1960-1971, 1974-1996, and 1997-2020. These periods were selected to coincide with the progressive movement away from public stocks as a primary US farm policy tool (see Note 1). The ratio generally declined in each succeeding period (see Figure 2). The decline was least for soybeans, which was expected since public stocks were smaller for soybeans. For all 3 crops, the ratio was smallest post 1996. Moreover, year-to-year variability of the ratio was smaller post-1996 than during the 1960s: 66% smaller for corn (4% vs. 12%), 59% smaller for wheat (11% vs. 27%), and 44% smaller for soybeans (5% vs. 9%) (see Figure 3).
Variability of Use
Given the smoothing function of stocks, declining stock-to-use ratios prompt the question, “Has US use of corn, soybeans, and wheat become more variable?” Variability of US domestic use, as measured by standard deviation of year-to-year percent change, has been smallest during the post-1996 period of little-to-no public stocks (see Figure 4). Variability of US soybean and wheat exports has not increased, but exports of US corn were notably more variable post 1996 (see Figure 5). The latter is due to a single event, the drought of 2012. If 2012 is excluded, standard deviation is 19%, not 39%. It is inappropriate to remove 2012 from the data set, but a large impact of a single event does imply caution in interpreting the variable.

Changing perspective, variability was greater for US exports than US domestic use in each period for all 3 crops (Figure 5 vs. Figure 4). In general, exports were more than twice as variable as domestic use. The higher variability of exports likely reflects a more price elastic demand for US exports than US domestic use. A more elastic demand for US exports likely reflects the availability of alternative suppliers, including Argentina, Australia, Brazil, Canada, Kazakhstan, Russia, and Ukraine.

Variability of Production and Prices
Another potential impact of lower stock-to-use ratios is higher price variability since supply is smaller. Price variability was lowest in the 1960s but has been the same since the 1973 farm bill allowed more downward price flexibility (see Figure 6). By the mid-1990s, price floors were eliminated for almost all US crops.
Declines in the variability of stocks and use could reflect declines in the variability of production. Annual variability of soybean and wheat production has not declined (see Figure 7). Annual variability of corn production may have declined, especially relative to the middle period of 1974-1996. Unlike corn exports, no single year / event appears to explain the high variability of corn production during 1974-1996. This finding tilts the explanation toward increased weather variability.
Assessment
The ratio of ending stocks to use for US corn, soybeans, and wheat has declined since 1960. A significant factor in this decline has been the elimination of most US public stock programs.
Stock-to-use ratios for US corn, soybeans, and wheat have also become less variable from year to year.
Despite the decline in level and variability of US stock-to-use ratios, US domestic use and exports of corn, soybeans, and wheat have not become more variable since 1960 and US market year price has not become more variable since the early 1970s.
In conclusion, from the perspective of the country as a whole, the US has substantially reduced corn, soybean, and wheat stocks relative to use without experiencing an increase in the variability of domestic use and exports since 1960 and an increase in the variability of market year price since the early 1970s.
Notes
- As is common, 1972 and 1973 are excluded as transition years between policy / market periods.
Source : illinois.edu