By Jonathan Coppess
Throughout its history, conservation policy can be understood, in part, as representing attempts at achieving balance. Policies have involved balancing the demands for producing crops with the limits of, and impacts on, natural resources; they have also tried to achieve different balances within production and among crops and land uses. This article continues the discussion on federal agricultural conservation policy with an overview of acres throughout the long history of the policy.
Background
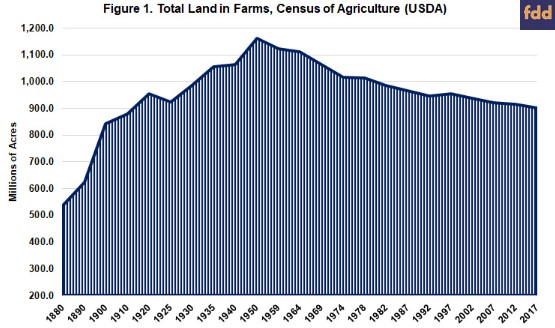
According to USDA’s Economic Research Service (ERS), the United States has a total land area of approximately 2.3 billion acres, of which roughly 1.9 billion acres are in the contiguous 48 states (Bigelow and Borchers, ERS 2017). The 2017 Census of Agriculture reported 900,217,576 acres of land in farms, of which 320,041,858 acres was harvested cropland; a reduction in land in farms from the 2012 census (914,527,657) but an increase in harvested cropland from 2012 (314,964,600 acres) (NASS Ag Census 2017). Figure 1 illustrates the total land in farms as reported by the Census of Agriculture and available on the USDA website from 1880 through the most recent census in 2017 (USDA Census of Agriculture). Land in farms can be seen to increase coming out of the Homestead Act of 1862 and through 1950, undergoing a steady decrease from 1950 to 2017.
For most of the years discussed in this article, the total acres in cropland used for crops occupies between 30% and 40% of the total land in farms. Acres planted to the major row crops will constitute between 70% and 80% of the total acres in cropland used for crops; an average of 74% since 1996.
Discussion
Of course, not all the land in farms can be (or is) used for producing crops. ERS also reports data for cropland in its Major Land Uses database (ERS-MLU). Figure 2 illustrates the total cropland that is used for crops as reported by ERS, which consists of total harvested acres of crops, plus acres of crop failure and cultivated summer fallow acres. In terms of the land used to produce crops, there appear to be two different levels as represented by the peaks and valleys in the area part of the graph. To highlight this, Figure 2 also includes the average of the peaks (red line) at 379 million acres and of the valleys (blue line) at 336 million acres.
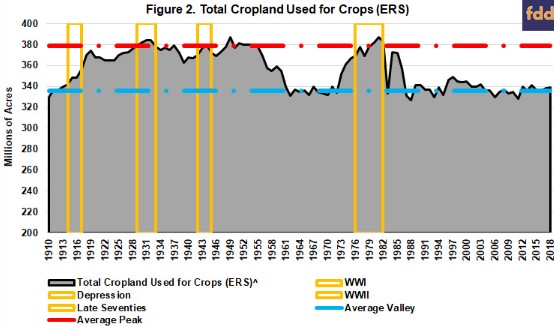
Historically, these are significant. The first set of peaks encompasses the increased acres for World War I, especially wheat. It was followed by an even higher level of acreage that was largely maintained through the 1950s, with specific peaks at the onset of the Great Depression and as a result of World War II and the Korean War; some level of reduction may have been achieved with New Deal polices. The second set of peaks encompasses the acreage expansion of the 1970s and into the second economic crisis of the 1980s. These historical markers are highlighted in Figure 2 (yellow boxes).
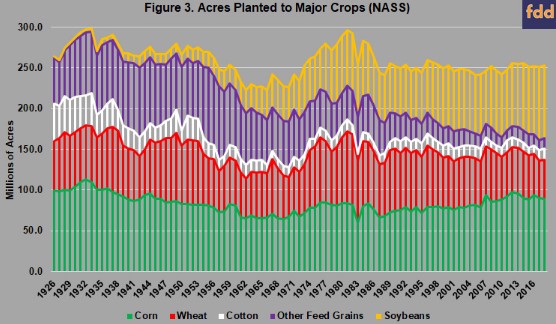
Providing further comparison, Figure 3 illustrates the planted acres for the major row crops as reported by NASS for each year from 1926 to 2018. The other feed grains (purple) includes barley, oats, rye and sorghum. Notably, the acres planted to these crops does not exceed 300 million acres in any year and there are two clear peaks in the acres planted to these crops. The first is 1933 (297.9 million acres) which corresponds with the Great Depression and passage of the Agricultural Adjustment Act of 1933. The second is 1981 (296 million acres), as the farm economy was falling into the economic crisis of the 1980s. The consistent increase in acres planted to soybeans also stands out. Since 1996 when Congress decoupled farm payments from planted acres, the total acres planted to these crops has not exceeded 260 million acres, even with the creation of the Renewable Fuels Standard (RFS) in 2005 and 2007.
One of the major features of farm policy since its inception in 1933 has been programmatic efforts to reduce the acres used to produce crops. Figure 4 illustrates the acres reduced by the specific policies and programs since 1933, including the average level of acres reduced by the programs for the entire period (30.8 million acres). It is a reproduction and modification of a chart produced in the 2017 ERS report (see, Figure 4, Bigelow and Borchers
, ERS 2017). Figure 4 also illustrates what appear to be three distinct eras of policy to reduce acres (Crosswhite and Sandretto 1991).
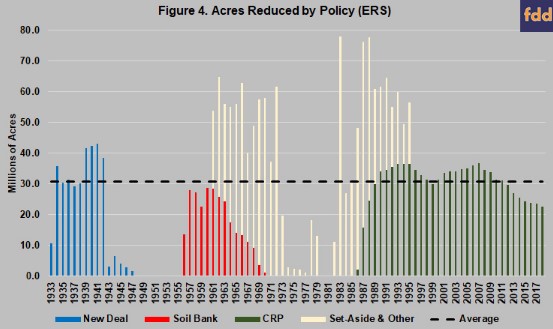
The first is the New Deal policies (blue bars) that sought to address the Great Depression and the Dust Bowl, as discussed previously (farmdoc daily,
October 24, 2019;
November 7, 2019). In general, Congress and USDA sought to adjust agricultural production by reducing acres of crops in surplus for which farmers were struggling with depressed prices. The ultimate goal of all the New Deal efforts was to improve crop prices and the farmer’s purchasing power (Coppess 2018). The New Deal policies addressed an average of 23 million acres from 1933 to 1947; excluding the war years increases the average to 32.7 million acres (1933 to 1941).
The second era encompasses the 1950s and 1960s, years of surplus commodities held in federal storage because they had been forfeited by farmers under the nonrecourse loans of the failed parity system. At the urging of President Eisenhower, Congress created the Soil Bank in the Agricultural Act of 1956. The Soil Bank consisted of an annual reduction program under which acres were removed from crop production and put into conserving uses (Acreage Reduction Program) and a long-term reserve program to remove sensitive acres from production and put them into conservation (Conservation Reserve Program). The Soil Bank was also designed to reduce the infighting amongst commodity interests over acreage reductions under federal programs, especially for cotton and wheat, that were shifting acres into corn and feed grains (Coppess 2018).
The Soil Bank begins to be replaced by a Payment-in-Kind (PIK) program created in 1961, which provided feed grain farmers with surplus commodities as a payment to reduce planting acres to those commodities. This policy would eventually be replaced a set aside acreage policy created in 1970, which required compliance with a set aside into conserving uses in order to receive federal assistance. The PIK and set aside policies are represented by the yellow bars and were brought back into use in the 1980s. Combined, PIK and set aside spanned both the second and third eras discussed here, averaging 31.3 million acres from 1961 to 1995; the 1996 Farm Bill ended these policies.
The third era encompasses the 1980s farm economic crisis that built during the acreage increase and expansion of the 1970s. Most notable is 1983 when the Reagan Administration instituted a PIK program to reduce acres as the crisis worsened, removing 77.9 million acres that year and the highest level removed in history thus far. This era is also highlighted by the creation of the modern Conservation Reserve Program (CRP) in the Food Security Act of 1985. CRP was designed to remove environmentally-sensitive lands from production under long-term rental contracts (ten to fifteen years). CRP has averaged 30.2 million acres since 1986, peaking in 2007 with 36.7 million acres enrolled. Overall, the set aside, PIK and CRP efforts during the Eighties farm crisis removed an average of 51.2 million acres from production.
Figure 5 completes this overview. Figure 5 compiles the data discussed in this article, with the total cropland used for crops (gray area) and the acres planted to the major crops (bars). It adds in the total acres reduced by policy, stacked on top of the acres planted (green and yellow bars). Figure 5 represents a near-complete picture of acres and policy at the national level since the onset of the New Deal legislation to reduce acres.
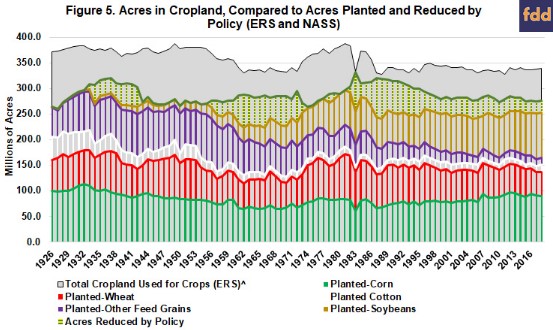
Among the highlights in Figure 5, are the relative stability of acres (both total cropland and planted) since the introduction of decoupling in 1996, even as CRP acreage has fallen in recent years. It also highlights the dominance of corn and soybeans since enactment of the RFS. Looking back, this level of stability aligns closely with the period 1959 to 1972 when total cropland acres used for crops were similar but planted acres and acres removed by policy were different. From 1959 to 1972, an average of 50.2 million acres were removed from production and farmers averaged 233.6 million acres planted to the major commodities. Corn acres made up roughly 30% of average plantings, followed by the other feed grains at 26% and wheat at 24%; acres planted to soybeans made up just over 15%. By comparison, since 1996 farmers have averaged 250.2 million acres planted to these commodities and 30.9 million acres reduced by policy. Of the planted acres, 34% were to corn, 30% to soybeans and 23.5% to wheat; the other feed grains fell to just under 7%.
The final highlight in Figure 5 is the comparison with the New Deal policy era. Notably, New Deal policies do not appear to have been effective in terms of reducing planted acres or total acres of cropland used for crops. From 1933 to 1941, covering the start of the New Deal through the beginning of World War II, ERS reported an average of 372.7 million acres of total cropland used for crops; from 1918 to 1932, the average was 373 million acres. Farmers planted an average of 279.1 million acres to the major commodities from 1933 to 1941, compared to 279.3 million acres from 1926 to 1932; New Deal policies addressed an average of 32.7 million acres. Corn constituted nearly 35% of planted acres, followed by the other feed grains at 27% and wheat at 25%. From Figure 5, it appears that most of the New Deal acreage impacts involved shifting acres among the crops planted, as opposed to removing acres from production.
Concluding Thoughts
USDA surveys in 1934 and 1935 concluded that there were 75 million acres of farmland considered unsuitable for cultivation, 55 million of those acres were in crops and pasture (Wooten 1953). Acres put under the plow and cultivated for the production of crops do not come out of farming easily, however. Adjusting agriculture or reducing the acres cultivated and planted often takes many years and significant expenditures. For example, the most the New Deal policies covered was 42 million acres in 1940, but few of the acres appear to have been removed from production. By comparison, the Kennedy-era PIK program, coupled with the dwindling Eisenhower Soil Bank, removed nearly 65 million acres in 1962; the Reagan Administration’s PIK removed nearly 78 million in 1983 and nearly as much in 1988 when coupled with CRP (and drought). Differences across the three eras in terms of acreage impacts raises further questions about policy mechanisms and program designs; issues that will be explored further in future articles.
Source : illinois.edu