By Joe Janzen and Jonathan Coppess et.al
Department of Agricultural and Consumer Economics
University of Illinois
On September 11, the USDA closed applications (except in limited circumstances) for the Coronavirus Food Assistance Program (CFAP). This program was intended to compensate farmers for market losses concurrent to the ongoing coronavirus pandemic. USDA projected making $16 billion in CFAP payments. In a previous farmdoc daily article (September 3, 2020), we suggested actual CFAP payments were unlikely to reach this $16 billion amount. For corn, soybeans, and other “non-specialty” crops (to use USDA’s CFAP classification), payments were expected to be less than projected because the actual quantity eligible for payment, unpriced inventory on January 15, 2020, was less than amount estimated by USDA, 50% of 2019 production.
We consider the size and distribution of CFAP payments across commodities and states with particular attention on “unpaid” payments. We define unpaid CFAP dollars as payments projected by USDA in its initial cost-benefit analysis for this program for which it did not actually make payment as of September 14. We find actual CFAP payments are considerably less than projected for all commodities. Across all crops and livestock, CFAP payments to September 14 are $9.9 billion or 62% of the initial USDA projection. Approximately $6.1 billion in projected CFAP payments are unpaid. Proportional to projected payments, unpaid CFAP dollars are greatest for hogs and specialty crops.
We also map payments by state. CFAP payments are generally concentrated in major agricultural production areas. For non-specialty crops, payments are greatest in the Corn Belt. When comparing projected and actual payments for non-specialty crops, we find some regional differences in the relative magnitude of unpaid payments. Actual payments are closer to projected amounts in the Western Corn Belt than the Eastern Corn Belt. Unpaid payments are particularly large in Texas and the Mississippi Delta.
Comparing Projected and Actual CFAP Payments by Commodity
In Table 1, we show projected and actual CFAP payments by commodity. We calculate unpaid payments as the difference between projected and actual payments. As projected, livestock commodities receive the bulk of CFAP dollars. Cattle producers receive $4.2 billion in CFAP payments. Dairy and hog producers are each paid approximately $1.7 billion through CFAP. For cattle, actual payments are relatively close to the projected amount. Unpaid payments, the difference between budgeted and actual, are proportionally larger for dairy and especially for hogs. 83% of CFAP dollars budgeted for cattle producers are now paid compared to 63% for dairy and 38% for hogs. Across these three commodities, CFAP dollars budgeted but unpaid are roughly similar at $0.8-1.0 billion each.
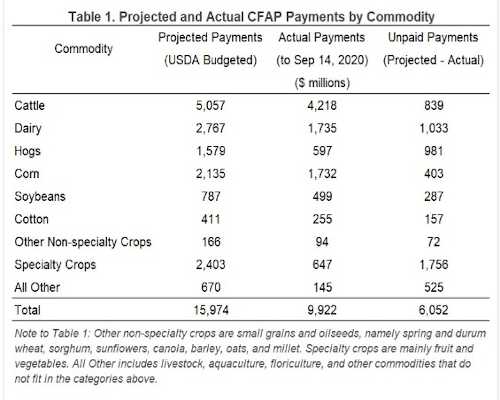
Actual CFAP payments for non-specialty crops were $2.6 billion versus about $3.5 billion in projected payments. Corn, soybeans, and cotton garner the largest payments; however, soybeans and cotton receive proportionally less of initial USDA projections compared to corn. In total, approximately $0.9 billion of budgeted CFAP payments for non-specialty crops remain unpaid.
Specialty crops and other minor commodities receive a far smaller share of budgeted program dollars compared to other commodities. Applications and payments for these categories increased in the final two weeks of the application period with nearly $200 million in payments issued over that time. However, $2.3 billion, or nearly three quarters of projected payments to specialty crops and other minor commodities remain unpaid.
Implications for Future Ad Hoc Payments
USDA has signaled additional ad hoc farm payments are forthcoming (here) as the coronavirus pandemic remains part of the market outlook for agricultural commodities. The considerable quantity of unpaid payments authorized under CFAP may also affect forthcoming farm payments. Without speculating on the distribution of expected future payments across commodities, we note all commodity categories had significant unpaid CFAP payments as shown in the last column of Table 1. This suggests future payments are likely to be similarly broad-based, with provision for payments to a wide range of agricultural commodities.
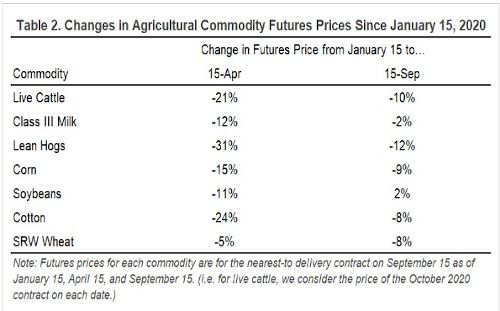
Recent increases in major agricultural commodity prices complicate the situation. Table 2 compares futures prices from January 15, 2020, the pre-coronavirus baseline chosen by USDA for CFAP, to prices on April 15 and September 15. For CFAP, price differences between January 15 and April 15 were used in part to estimate the market impact of the coronavirus pandemic. Futures prices have generally rebounded since mid-April for most agricultural commodities except for wheat. Recall many wheat producers were ineligible for CFAP payments because wheat price declines for some major classes of wheat were too small to trigger a payment.
Table 2 shows that for dairy and soybeans, current prices as of September 15 are near or above January 15 levels. For other commodities, current futures prices are 8-12% below January 15 levels. Both current market conditions and unpaid CFAP payments may play a role in determining future ad hoc farm payments.
Projected and Actual CFAP Payments by State
The distribution of CFAP payments across commodities described in Table 1 has direct implications for the distribution of CFAP payments across states. Figure 1 plots actual CFAP payments for all crop and livestock commodities. In general, CFAP payments are correlated with the value of agricultural production. Payments are concentrated in the Corn Belt, Texas, and California.
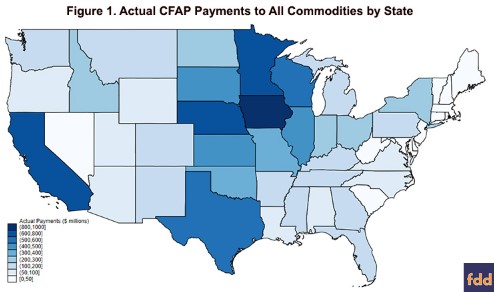
However, some regions receive relatively larger payments because they produce commodities favored by the program, especially cattle, hogs, dairy, and corn. For instance, Iowa led the nation in the value of corn and hog production in 2019. It also produces substantial quantities of cattle and other field crops. Unsurprisingly, Iowa receives the most CFAP payments, $961 million.
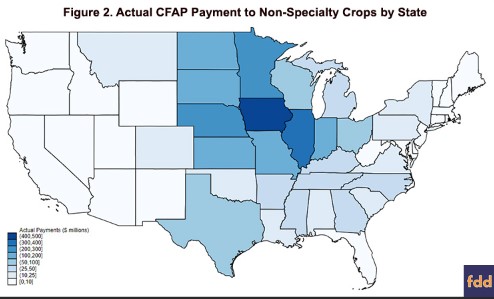
To assess the magnitude of unpaid CFAP dollars across states, we focus on non-specialty crops. (Recall corn, soybeans, and cotton are responsible for nearly all non-specialty crop CFAP payments.) Figure 2 maps CFAP payments for all non-specialty crops by state. Payments are concentrated in the Corn Belt. Iowa leads the country in CFAP payments to non-specialty crops, with Illinois, Nebraska, Minnesota, and Indiana also among the top five states. Payments to cotton generate sizable but smaller CFAP receipts in Texas and other southern states.
We compare actual CFAP payments shown in Figure 2 to projected payments calculated using the procedure described in USDA’s CFAP cost-benefit analysis. Projected CFAP payments are 50% of 2019 production multiplied by a given payment rate, then adjusted downward to account for the impact of payment limits. For non-specialty crops, the payment limit adjustment factor is 0.93: projected payments are 93% of (quantity x payment rate).
Figure 3 shows non-specialty crop CFAP payments by state as a percentage of the projected amount. Areas with a higher percentage have fewer unpaid CFAP payments. Broadly, actual payments are closer to budget projections in the Western Corn Belt (Wisconsin, Minnesota, Iowa, and South Dakota) than the Eastern Corn Belt (Ohio, Indiana, Illinois). The reason for this geographic disparity is not obvious; on-farm inventories of corn and soybeans tended to be larger relative to production in the Western Corn Belt in early 2020, but this association is not particularly strong. (Recall that actual CFAP payments were based on inventories not production, even though payment projections were based on production.)
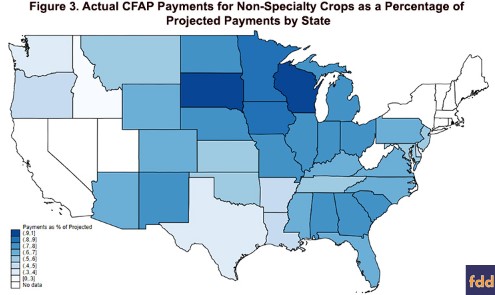
Non-specialty crop CFAP payments were particularly small relative to projected levels in Texas and the Mississippi Delta. Payments to cotton were relatively low in these states (compared to other cotton-growing states) but we do not have data on farmer-held cotton inventories to help explain why this is so. It should be noted that the CFAP application deadline was extended for areas of Texas and Louisiana affected by a recent hurricane.
Conclusion
CFAP payments did not exceed the $16 billion projected by USDA when the program was announced. Actual payments to all commodities were $6.1 billion less than projected. All commodities had unpaid CFAP payments, but unpaid payments were proportionally greater for hogs and specialty crops. The significant magnitude of unpaid CFAP dollars for so many commodities may create impetus for further ad hoc payments distributed across a similarly wide range of commodities.
CFAP payments were generally concentrated in states that produce large quantities of commodities allocated the most CFAP dollars: cattle, dairy, hogs, and corn. For non-specialty crops, CFAP payments were concentrated in the corn belt. Comparing actual and projected payments for non-specialty crops by state, we find that unpaid CFAP payments were proportionally smallest in the Western Corn Belt. Differences between projected and actual payments across space may be related to the specifics of CFAP program design such as the unpriced inventory criteria for non-specialty crops, but we cannot find conclusive evidence of this.
Source : illinois.edu