By Todd Hubbs and Scott Irwin
Department of Agricultural and Consumer Economics
University of Illinois
USDA’s release of the Crop Progress report on May 20 showed corn planting at 49 percent nationally. The planting progress in numerous major corn producing states lags behind historical averages significantly. The implications for corn acreage and yield are potentially large in 2019. The purpose of this article is to explore the implications of late planting on corn acreage and yield and investigate the consequences for the corn balance sheet in the 2019-20 marketing year.
Acreage Implications
We begin by reviewing the estimates of late planting for corn presented in first presented in the
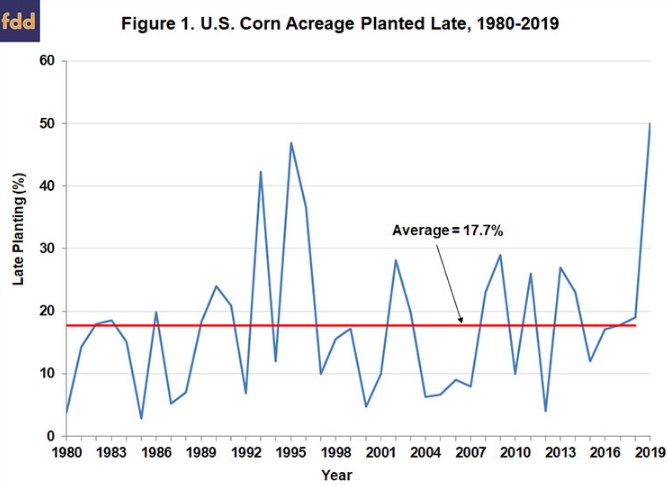
April 24th farmdoc daily article and updated here for 2019. Figure 1 shows the percentage of corn planted late in the U.S. over 1980-2019 based on a May 30 cutoff from 1980 through 1985 and a May 20 cutoff date from 1986-2019. The change in cutoff dates in the mid-1980s reflects recommendations for earlier planting that appeared around that time. On average, late planting based on this measure was 17.7 percent, with the bulk of the observations between about 5 and 25 percent. Planting progress in the 18 major corn producing states sits at 49 percent as of May 19 (USDA). Assuming some progress on May 20, approximately 32% above the average (or 42 million acres of corn) remain unplanted this planting season. This raises the question of the magnitude of prevent plant acres for corn this year. While many comparisons of the planting situation this year invoke 1993, 1995, or 1996, crop insurance products were very different and not widely purchased. Prevent planting of corn acres is a relatively new addition to farm programs through crop insurance.
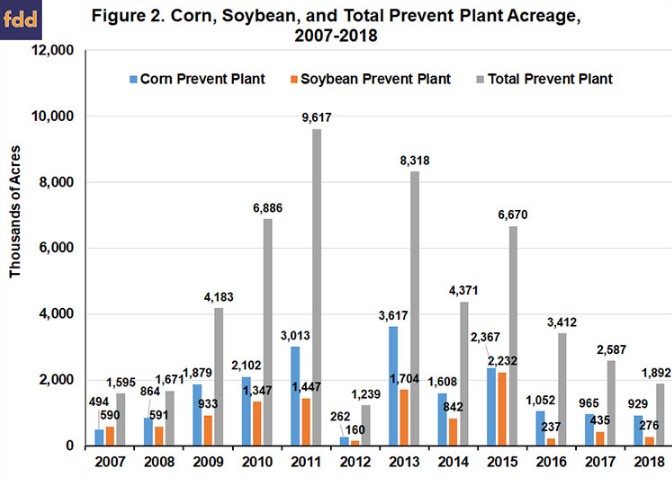
Data on prevent plant acres is available from the Farm Service Agency since 2007. Figure 2 shows corn, soybean, and total prevent plant acreage by year since 2007. As can be seen in Figure 2, the largest acreage total for prevent plant of corn occurred in 2013. Recent weather patterns increase the potential for prevent plant acreage in corn to surpass the 3.6 million acres seen in 2013. Many of the states which saw large prevent plant acreage in 2013 appear set for another major acreage set aside this year. North Dakota, Minnesota, and Iowa recently received large amount of rain and the entire region faces prevent plant dates on May 25 or May 31. Additionally, large producing states in the eastern Corn Belt sit well behind the average pace for corn planting with Illinois, Indiana, and Ohio all coming in greater than 50 percent behind.
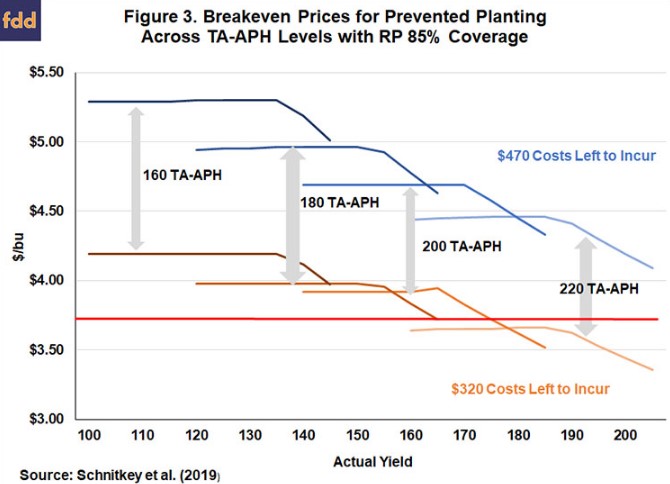
While the desire to plant may be strong, current harvest prices may be too low to incentivize planting corn compare to prevent plant. In the
farmdoc daily article of May 21, detailed analysis on the implications of very late planting and the prevented planting decision is laid out in detail. Figure 3 provides the break-even prices of corn for prevented planting with 85 percent coverage levels under two cost structure scenarios. One scenario (orange lines) indicates some input costs incurred. The other scenario (blue lines) show break-evens when input costs remain for planting. The red line on the graph shows current central Illinois harvest prices of $3.85. It is obvious the market has yet to buy prevent plant acres from a significant portion of producers considering prevented planting. Current prices look promising for high-yielding producers who incurred some costs already this year. It is hard to determine how many operations fit into each category, but it is safe to say millions of acres fall above the line. While this data focuses on Illinois, analysis out of Kansas (Vandeveer, 2019) provides similar results for a western Corn Belt state.
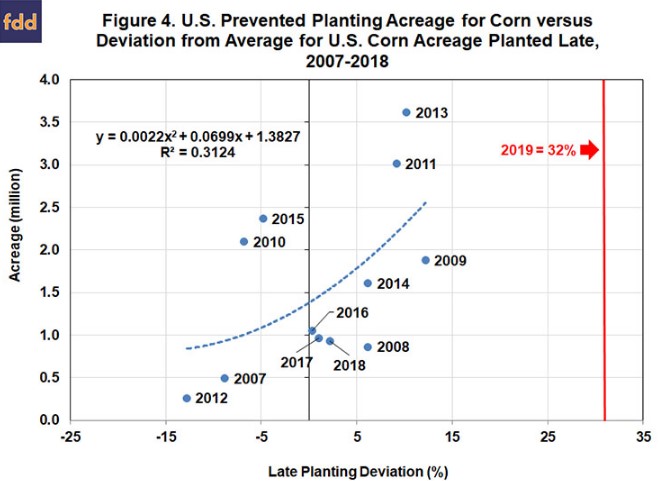
In total, 50 percent of the corn crop remains unplanted relative to the 17.7 percent average since 1980. This is the largest acreage total since the advent of prevent plant policies was created and brings into question just how much acreage will go unplanted this year. Figure 4 shows the relationship between deviations in late planted corn acreage using May 20 as the cutoff date and prevent plant acreage since 2007. While the model possesses low predictive power on such a small sample size, the potential for exceeding the 2013 prevent plant acreage of corn seems strong. An expectation of a minimum of 5 million prevent plant acres appears not only feasible but reasonable. The total could be much larger since approximately 42 million acres remain unplanted in the 18 states observed by NASS for planting progress of corn and current weather patterns continue to hamper planting in many areas that are approaching the prevent plant decision date.
An additional consideration on acreage is the fact that payments associated with the new Market Facilitation Payment (MFP) program are in flux. The program was announced today but payment rates are unknown as well as the exact formula for computing payments for eligible acres. As announced, the payments are coupled to planting acreage in 2019, which could possibly skew incentives towards planting corn compared to taking prevent plant. However, the U.S. Senate also passed a new disaster assistance bill today that allows prevent plant acreage to be eligible for special disaster assistance payments in addition to a prevent plant payment. There is considerable uncertainty with respect to how this will impact planting and prevent plant decisions for corn and the bill still must be approved by the House Representatives and signed into law by President Trump. Still, we argue that it is reasonable to expect that disaster payments for prevent plant will roughly balance MFP payments for planted acreage. This appears to be the clear intention of the Senate bill. If this is the case, then current policy incentives will be a wash as far as prevent plant versus planted acreage is concerned in 2019.
Yield Implications
We next review the estimates of late planting and corn yields presented in the
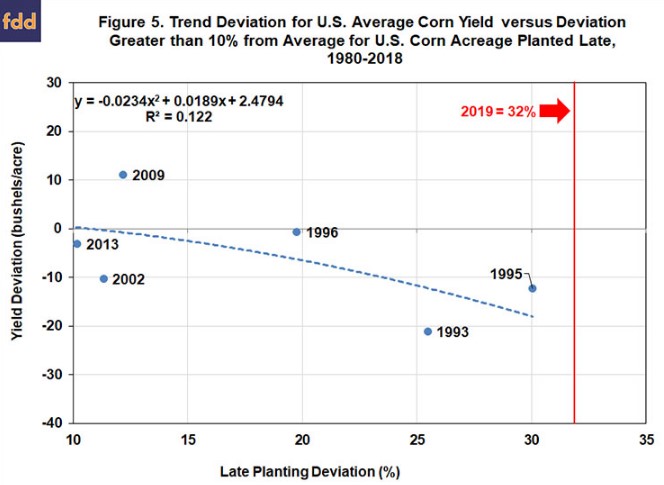
farmdoc daily article of May 1. We estimated the relationship between the trend deviation for U.S. corn yield and the deviation from average for U.S. corn acreage planted late over 1980 through 2018. There exists a negative relationship between late planting and corn yield deviations from trend. However, the relationship is highly non-linear, with a largely flat segment up to 10 percent above average late planting and then a steeply sloped segment for late planting that is 10 percent or more above average. Specifically, for late planting that is 10 percent or more above average the regression model indicates that for each 1 percent increase in late planting the national average corn yield drops by about 0.9 bushels per acre.
Figure 5 provides the observations for all years since 1980 when late planting is 10 percent or more above average. When one includes 2019, only seven instances of late planting occurred of this magnitude. This year is well above previous instances and points towards lower yields. The estimated regression relationship shown in Figure 5 shows the fit for the entire sample. Specifically, when late planting is 10 percent or more above average the chance of corn yield being below trend is 83 percent and the average deviation from trend yield is -6.1 bushels per acre. In 1993 and 1995, the yield came in over 10 bushels below trend. Since these are the years mentioned most frequently when discussing this year’s planting pace, the implication is that there is a significantly elevated probability of a below-trend corn yield in 2019 and that present projections of U.S. average corn yield should likely be reduced to 170 bushels per acre or less. It is important to recognize that good summer weather conditions can offset the projected negative impact of late planting on the national average corn yield.
Corn Balance Sheet Implications
The implications of the acreage and yield projections for corn supply may be drastic. We begin the analysis by focusing on the initial 2019-20 marketing year projections for the corn balance sheet provided in the May WASDE report. Table 1 provides the May WASDE projection in the first column and two separate supply scenarios in the remaining columns. Despite significant planting delays, the USDA chose to maintain yield at the trend calculation of 176 bushels per acre. Planted acreage also remained at the March Prospective Plantings report total of 92.8 million acres resulting in corn production totaling 15.03 billion bushels. The initial consumption projection sits at 14.675 billion bushels leading to a carryout of 2.485 billion bushels at the end of the 2019-20 marketing year.
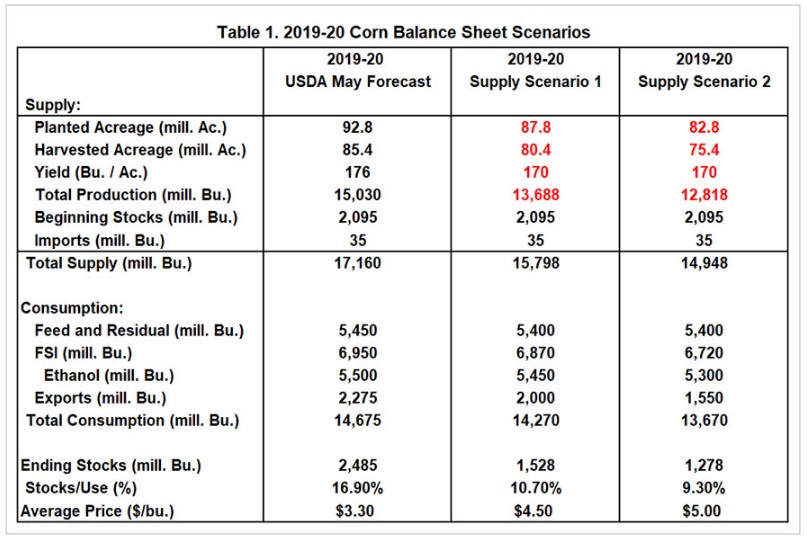
Based on the above analysis of acreage and yield, we look at the implications of 5 and 10 million acre reductions in planted corn with a 170 bushel per acre yield for the 2019 crop. The scenario associated with 5 million fewer planted acres results in production at 13.68 billion bushels. Under this scenario, an expectation of lower consumption across all categories is incorporated into the analysis with the largest reduction coming in the export market. This scenario leads to an ending stock total of 1.528 billion bushels. Based on the stocks-to-use ratio of 10.7 percent and minor demand rationing, average corn price is estimated at $4.50 per bushel. One could expect stronger imports or greater loss in demand in some categories. However, the substantial beginning stocks may mitigate severe rationing under this scenario.
In the 10 million acre loss scenario, an expectation of substantial demand rationing comes into focus. Total production equals 12.8 billion bushels and results in expected supply falling to below 15 billion bushels. Total consumption falls to 13.67 billion bushels with substantial reductions occurring in ethanol and export use during the 2019-20 marketing year as demand rationing picks up substantially. Ending stocks are projected at 1.278 billion bushels. A stocks-to-use ratio of 9.7 percent leads to an average farm price of $5 per bushel. The prospects of even larger acreage and supply reductions than considered here cannot be ruled out as wet weather and policy decisions are fully absorbed as we head into late May.
Summary
The impact of late planting in 2019 on corn acreage and yield is an important question now due to the potential for a large supply shock to corn supply that is roughly equivalent to a major drought. We estimate corn acreage reductions at a minimum of 5 million acres due to prevent plant decisions and acreage switching. Acreage losses could grow and depend on policy decisions and weather conditions over the next few weeks. There is a significantly elevated probability of a below-trend corn yield in 2019 and that present projections of U.S. average corn yield should likely be reduced to 170 bushels per acre or less. While good summer weather could mitigate yield losses, corn yield will be impacted as planting stretches into June. Substantial supply reductions of at least 1 to 2 billion bushels appear likely, with prices climbing to $4.50 or above to ration demand in line with the available supply.