By Joe Janzen
Department of Agricultural and Consumer Economics
University of Illinois
On Tuesday July 12, the USDA released its latest World Agricultural Supply and Demand Estimates, or WASDE. The WASDE report provides an updated point of reference for agricultural commodity price expectations. This article discusses adjustments made by USDA to its new-crop US corn and soybean balance sheets and one thing to watch going forward: changing expectations about the size of the 2022 US crop, specifically changes in crop yield estimates forthcoming in the August 2022 report.
The July WASDE report contains one substantial change to the supply and demand balance for corn and soybeans. Planted and harvested acreage numbers are updated to reflect figures released by the National Agricultural Statistics Service (NASS) in its Acreage report on June 30, which showed slightly higher corn acres and substantially lower soybean acres than previously estimated. (For more analysis of the June Acreage report, watch the replay of the June 30 farmdoc webinar: https://www.youtube.com/watch?v=n2mtWJgJplQ)
The July WASDE report may be most notable for changes not made to the balance sheet. Yield and most use quantities are unchanged relative to the previous month’s estimates. Yield estimates do not reflect ongoing concerns about dryness in the US Midwest. The net result is a slight increase in ending stocks for corn and a decrease for soybeans, though the supply and demand balance for both crops remains historically tight. New-crop futures prices have declined in recent weeks in part because of weakening macroeconomic conditions and fears of recession-driven weakness in global commodity demand.
Bigger changes to corn and soybean balance sheets are coming. Their impact on price may be substantial given how low new-crop ending stocks are already projected to be. The July WASDE report does not reflect either updated expectations about crop conditions. To form expectations about the prospective magnitude of these changes, I review historical changes to WASDE-estimated crop yields. The largest changes to crop yield estimates typically occur between the July and August reports with an average correction of approximately five bushels per acre for corn and two bushels per acre for soybeans. Revising current yield estimates lower by this amount would dramatically tighten the supply and demand balance, especially for soybeans.
Current USDA New-crop Supply and Demand Estimates
Table 1 shows changes in the new-crop 2022/23 US balance sheets for corn and soybeans between the June and July WASDE reports. The largest changes are to acreage with area planted increasing by 400 thousand acres for corn and decreasing 2.7 million acres for soybeans. Yields are unchanged, though the 177 bu/ac yield estimate for corn is a decrease of four bu/ac from the 2022 trendline yield made in the May report. Changes in old-crop usage combined with acreage-driven production changes lead to an increase in available new-crop supply of 70 million bushels for corn and a decrease of 125 million bushels for soybeans.
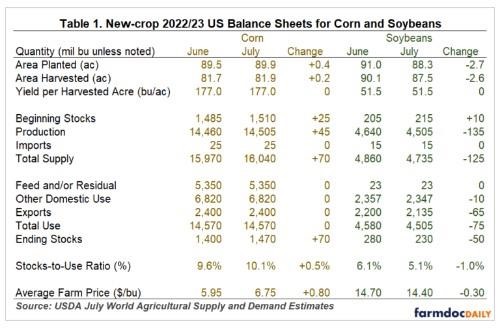
New-crop use is unchanged for corn, implying an increase in US corn ending stocks of 70 million bushels and an increase in the stocks-to-use ratio from 9.6 to 10.1 percent. Note that corn ending stocks-to-use remains near the threshold level of ten percent. Historically, prices have been higher and more volatile when corn stocks-to-use falls below ten percent. (See farmdoc daily April 9, 2015.) Corn futures prices along the new-crop forward curve show modest carry.
Soybean domestic crush and export use for 2022/23 are both revised lower, with total use declining 75 million bushels relative to the June report. High prices and increased export competition are expected to limit demand for US soybeans. Changes in expected use of US soybeans are nonetheless smaller than the changes in total supply, so soybeans are expected to be increasingly scarce at the end of the 2022/23 marketing year. The stocks-to-use ratio is lowered from 6.1 to 5.1 percent. Broadly, the soybean supply and demand situation remains tight. Despite new-crop soybean futures prices falling by nearly $2/bushel in the past month, the futures forward curve remains flat or inverted.
Historical Changes to USDA Corn and Soybean Yield Projections
The supply and demand balance shown in USDA’s new-crop 2022/23 balance sheets for corn and soybeans reflects the continued assumption that yield expectations have not declined in response to observed growing season weather. Projected yields remain at the level given in the initial 2022/23 balance sheets from the May WASDE report.
To understand the likely timing and size of possible yield forecast changes, this article reviews historic changes in WASDE-projected corn and soybean yields from 2010 to 2021. Figure 1 shows the time path of WASDE-projected yields for corn and soybeans in each month’s report relative to the initial forecast given in the May WASDE each year.

The current situation, where WASDE yield estimates are unchanged between May and July, is quite common. Generally, USDA does not update yield projections until the August WASDE report which is released concurrent with the first NASS Crop Production estimates of the year for corn and soybeans. The time path for 2021 yields highlighted in Figure 1 is typical in this regard. The major exception was the drought-stricken 2012 crop where USDA revised corn and soybean yields sharply lower beginning with the July WASDE report. In that year, corn yields were lowered by 20 bu/ac between the June and July report.
Figure 1 also suggests that changes in projected yields are largest between the July and August report. The average absolute change (up or down) in WASDE-projected yield between the July and August report is on average more than double the average month-to-month change at any other time of year. Figure 1 also dispels the myth (See also: farmdoc daily September 28, 2016) that large crops always get larger and small crops always get smaller. Yield increases between the July and August reports are not necessarily followed by further increases (and vice versa). For example, 2016 soybean yields did indeed see a large crop get larger with a series of continued yield increases between the August and November reports. In contrast, the 2012 soybean yield was first revised lower by nearly nine bushels per acre. Subsequent reports increased soybean yield so that final yields were only 4.3 bu/ac smaller than the initial forecast.
To assess the possible magnitude of forthcoming changes in WASDE-projected yields from the current July 2022 figures of 177 bu/ac for corn and 51.5 bu/ac for soybeans, Figure 2 plots the July-to-August projected yield change for all crop years from 2010 to 2021. The average absolute change in yield regardless of direction, indicated by the dashed lines, is 5.0 bu/ac for corn and 1.8 bu/ac for soybeans. This average is strongly influenced by the massive yield changes observed in 2012, especially for corn.
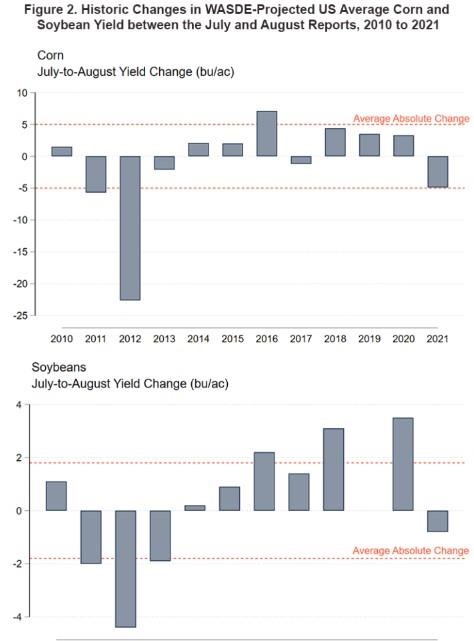
Suppose that current drought concerns in the US corn belt manifest themselves as lower yield projections in the August WASDE by the average amount given in Figure 2. Updating the July WASDE balance sheet given in Table 1 with a corn yield estimate of 172.0 bu/ac and a soybean yield estimate of 49.7 bu/ac gives projected ending-stocks-to-use ratios of 7.2% for corn and 1.6% for soybeans. These would be extremely bullish levels for new-crop prices, however they assume no corresponding changes to corn and soybean use. Some demand-side response to lower US crop yields is almost certain.
Conclusions
The July WASDE report made limited changes to new-crop 2022/23 US corn and soybean balance sheets. Historic experience suggests bigger changes are forthcoming. Large changes in yield projections are likely in the August WASDE report. Lower yield forecasts in line with average absolute changes observed from 2010 to 2021 would make the supply and demand balance extremely tight, especially for soybeans. In that scenario, high prices and greater price volatility are likely.
However, historical WASDE reports on their own provide no consistent indication about the direction of possible yield changes. It is worth noting that USDA has already revised its 2022 corn yield estimate lower relative to trendline yields. Moreover, this analysis does not factor in possible changes in corn and soybean demand caused by a global macroeconomic slowdown, rising export competition, or other factors.
Source : illinois.edu