By Jonathan Martin
Staff Writer
Farms.com
Source: https://twitter.com/Clarklynd/status/1133401133836394500
Good question, Brad!
For simplicity’s sake, let’s look at the corn heat units (CHU) between May 1 and Oct. 15 so that we have a defined area in which to work.
Last year, the total CHU between those dates was 3266.1.
If this season were to average 4 degrees lower, we’d end up with 2373.6 CHUs.
That means you’d potentially lose around 892.5 CHUs in 2019.
For the fun of it, let’s look at the normal May 1 to Oct. 15 CHU between 1980 and 2010:
Over the past 30 years, the normal CHU between May 1 and Oct. 15 was 3311.3.
If you take away an average of 4 degrees over 30 years, you get 2230.3.
Here’s how that looks on a graph:
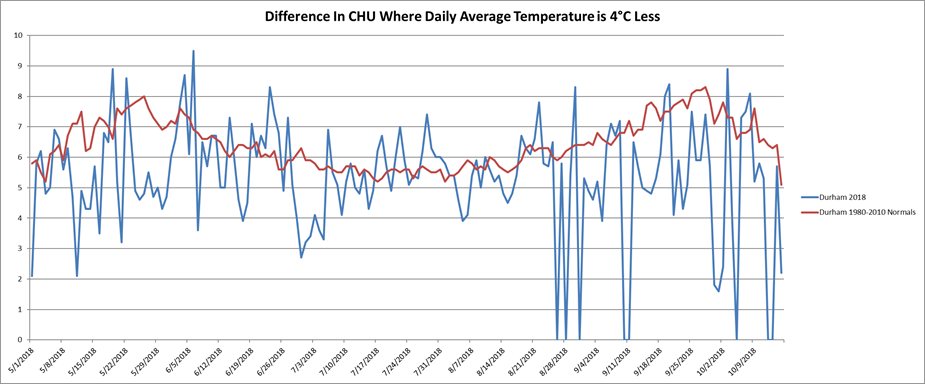
Source: Weather INnovations Consulting LP.
You, probably: “Those are some crazy numbers, @OntAg! How did you calculate them?!”
Another good question!
Well, Curious Reader, we have some friends in nerdy places.
Manish Patel is a partner in Weather INnovations Consulting LP. He develops software that does these types of calculations so we don’t have to.
“Most farmers know how to use CHUs, but knowing how to calculate them is less important for end-users,” Patel told Farms.com. “It’s a comprehensive set of data. We interpolate the weather data for a specific field within specific parameters depending on each query.
“For Brad’s question, we used simple calculations. We used quadratic equations for the Tmax (the daily maximum temperature) and linear equations for the Tmin (the daily minimum temperature) in our calculations of CHUs.”
Data gathered between the daily Tmin and Tmax thresholds is used to calculate the daily CHU value, which is then added to the sum of previous days’ CHUs. Different hybrids of corn require different total CHUs over the growing season to reach maturity.
The CHU model uses separate calculations for maximum and minimum temperatures.
The maximum, or daytime, relationship uses 10 C (50 F) as the base temperature and 30 C (86 F) as the ceiling, because warm-season crops don’t develop when daytime temperatures fall below 10 C and develop fastest at about 30 C. The minimum, or nighttime, relationship uses 4.4 C (39.9 F) as the base temperature and doesn’t specify an optimum temperature, because nighttime minimum temperatures rarely exceed 25 C (77 F) in Ontario.
The nighttime relationship is considered a linear relationship. The daytime relationship, in contrast, is considered non-linear because crop development peaks at 30 C and begins to decline at higher temperatures.
Farmers can use CHUs to decide what to plant and determine how their crop will grow, since different critical growth stages occur within certain CHU ranges. Different diseases also thrive within certain CHU ranges, so farmers know what to look out for if their fields’ CHU values fall between two numbers.
Agronomists help farmers translate the data and advise them on how to apply it to their crop plans. Dale Cowan is a senior agronomist and certified crop adviser who does just that.
He told Farms.com that southwestern Ontario will need a “a nice, warm September and most of October to mature the crop that has already been planted, even if it is a (hybrid of corn) that needs fewer heat units.
“From May 1 till now, we’ve accumulated fewer heat units than 2018, so we can tell that it’s been a cold, miserable May, which any farmer will tell you just by having experienced it.”
Most farmers are interested in the CHU number for the day and how it compares to the previous year, Cowan added. He uses software to build a variety of virtual fields, inserts the CHU values based on weather predictions and runs simulations to see how crops will grow.
The simulations are estimates, though. Cowan and Patel agree that what they’re really doing is helping farmers plan for what Mother Nature might throw at them.
And, as this year has shown, she’s an unpredictable beast.