Has your solar energy output seem sub-par since last winter? You’re not alone! Other farmers across the state of Michigan have been experiencing lower production from their solar energy systems since December. Results from solar energy pilot farms in the Michigan Farm Energy Program’s network of case studies and educational sites shows substantially lower energy production values compared to predicted values.
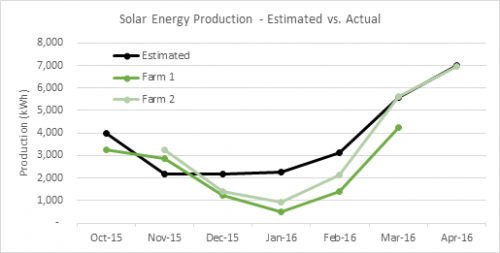
Estimated solar energy production compared to actual production from two Michigan farms that have implemented solar energy systems.
This pervasive production loss is caused by the above-normal cloud cover in Michigan due to the effects of El Niño. This recurring weather pattern is characterized by unusually warm ocean temperatures in the Equatorial Pacific, leading to warmer temperatures and generally drier conditions for the Midwest regions. This year, the observable effects of El Niño in Michigan began in December of 2015 and are expected to last until May 2016 (NOAA, 2016). The impacts of El Niño on cloud-cover can be seen in the table below, which demonstrates a 58 percent decrease in the number of fair days and a marked increase in the number of partly cloudy (31 percent) and cloudy days (61 percent) compared to historical averages. With a combined 53 percent increase in partly cloudy and cloudy days coupled with a significant decrease in fair days from December 2015 to April 2016, it’s no surprise that solar energy production has recently taken a hit in Michigan.
Though the past several months’ production levels look dismal, don’t worry! The effects of El Niño are predicted to dissipate this month, bringing us back to more normal cloud cover conditions. This solar energy production dip though significant, shouldn’t put a substantial dent in annual solar energy production levels, since the majority of solar energy is generated in the summer months. Just hold out until the end of May, and your solar energy system will likely be producing at projected levels once again.
Number of fair, partly cloudy, and cloudy days in Michigan (Detroit location base) compared to historical averages |
|---|
Month | Avg. Sky Cover1 | No. of Fair Days | No. Partly Cloudy Days | No. Cloudy Days |
Actual1 | Avg.2 | Actual1 | Avg.2 | Actual1 | Avg.2 |
Dec-15 | 90% | 0 | 3 | 7 | 6 | 24 | 9 |
Jan-16 | 80% | 1 | 4 | 8 | 7 | 22 | 11 |
Feb-16 | 80% | 1 | 5 | 14 | 7 | 14 | 11 |
Mar-16 | 80% | 1 | 6 | 12 | 7 | 18 | 13 |
Apr-16 | 70% | 7 | 6 | 5 | 8 | 18 | 14 |
Ave. Diff. | | -58% | | 31% | | 66% | |
Source:msu.edu