By Gary Schnitkey, Nick Paulson, and Dale Lattz
Department of Agricultural and Consumer Economics
University of Illinois
Returns to farms vary from one year to next due to variation in prices, yields, and costs. Within a year, some farms will have higher returns than others. Over time, there are some farms that tend to persist in having high returns. Over time, the returns of these more profitable farms tend to average $20 and $30 per acre higher than the average of all farms.
Farms Used in Comparisons
Data from Illinois Farm Business Farm Management (FBFM) was used to evaluate returns for a restricted set of farms. These farms had to be:
- Located in McLean County.
- Had high soil productivity on their farms.
- Received the vast majority of their farming income from grain operations.
Farms were picked from a small area (McLean County) to limit the impacts of weather and local markets on returns. Farms were limited to a small soil productivity range so as to reduce the impacts of soil differences on returns.
Focus was given to grain operations to assure that difference in farm types was not causing relative return differences. This does not imply that livestock and other enterprise are unimportant. Rather, focus was given to management of grain farms and not to farm type.
Similar analyses were conducted in other areas of the state. Results are similar to those presented here.
Operator and Land Returns
Per acre operator and land returns is the measure of return. Operator and land return equals gross revenue minus non-land costs and is the return before paying for farmland. Farm returns will vary based on whether farmland is owned, share rented, or cash rented. We are not ranking farms based on land control, rather on the ability to generate returns from farmland.
Figure 1 shows operator and land returns for the McLean County grain farms in this study. The average operator and land returns from 1995 to 2003 was $160 per acre. From 2004 and 2006, operator and land return increased and averaged $208 per acre. Then, higher returns occurred in most years from 2007 through 2013. From 2007 to 2013, operator and land return averaged $395 per acre. Since 2012, operator and land returns have trended down, with the 2015 operator and land return averaging $184 per acre. All farms, no matter their relative profitably face the return variability depicted in Figure 1.
Correlation between Rank of Operator and Land Return
In each year, farms were ranked from highest to lowest based on per acre operator and land return. Correlations were then calculated between yearly ranks.
The correlation coefficient between adjacent year's ranks was .40. Correlation coefficients for returns typically range from 1.0 to 0.0. A correlation coefficient of 1.0 would indicate the rank stayed the same across years. That is a farm ranked first in 2014 would be first in 2015, the farm ranked second in 2014 would be second in 2015, and so on. A value of zero would indicate there is no relationship between a farm's rank in one year and that rank in the next year. The .40 is between zero and one. There is persistency in ranks across years, but there are other factors impacting ranks.
Those other factors likely are relative prices, yields, and costs. In any given year, a farm's rank is heavily influenced by yields and prices received for crops. In any given year, a farm may have had an exceptionally high yield or price. However, high relative yields and prices may not be maintained over time. The importance of these random factors will be reduced if more years are averaged together.
Operator and land returns were averaged over a two-year period and then correlation coefficients were re-calculated. For example, operator and land returns were averaged including 2012 and 2013 and then the farms were ranked, operator and land returns were averaged including 2014 and 2015 and then ranked, and then a correlation coefficient was calculated between the 2012-13 and 2014-15 rankings. This process was completed for all two-year periods from 1995 to 2015. The process was then repeated for three-year average periods, four-year average periods, and five-year average periods.
Correlation coefficients based on comparing returns averaged over two, three, four, and five years are:
One-year average: .40
Two-year average: .50
Three-year average: .57
Four-year average: .60
Five-year average: .60
Note that the correlation coefficients go up, particularly as the averaging period increases from one to three years.
Difference in Returns over Time
To illustrate profitability differences for farms, farms were placed in three profitability groups based on operator and land return for the three-year period from 2009 to 2011. The three groups represent farms with the highest one-third of returns, the mid one-third had middle one-third returns, and the low one-third had the lowest third of returns. The average operator and land returns were $359 per acre for the high one-third group, $310 per acre for the mid one-third group, and $272 per acre for the low one-third group. There was a $49 difference in returns from the high one-third to mid one-third group and an $86 per acre difference from the high to low one-third groups.
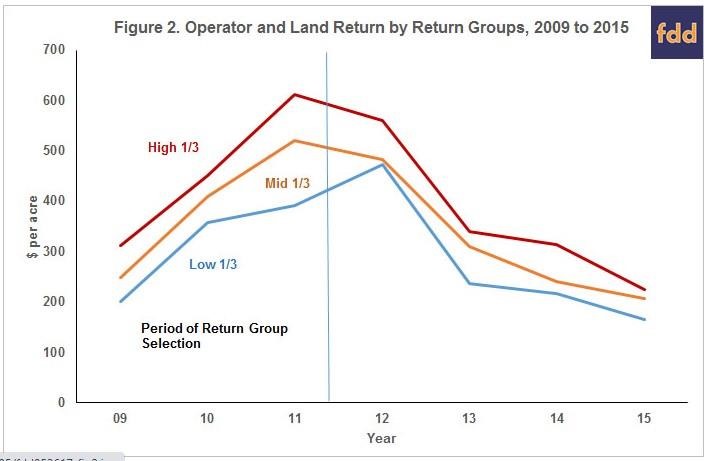
Returns were tracked for these three profitability groups from 2012 to 2015 (see Figure 2). Note that average returns for the three groups continued to differ after the averaging period. In 2015, the high one-third group based on the 2009-11 ranking had an average return of $224 per acre, the mid one-third group had $207 per acre, and the low one-third group had $164 per acre. In 2015, operator and land return differed by $17 per acre for the high one-third group and the mid one-third group. The difference was $60 per acre between the high one-third and the low one-third group.
The above process was repeated for other time periods from 1995 to 2014. Over time, farms do have differences in returns which persist. Four years after forming the returns group, the high one-third farms have $20 to $30 per acre higher returns than the average.
Summary
There are farms that tend to be more profitable than other farms over time. Future articles will evaluate those factors that cause farms to stay in the high and low profitability groups.
More profitable farms face the general market changes as all farms. More profitable farms also do not always rank as the most profitable each year because
Acknowledgements
The Illinois Soybean Association provided funding and support for a profitability study that has resulted in these articles. More information on the Illinois Soybean Association can be found at https://www.ilsoy.org.
Data used in this study comes from the local Farm Business Farm Management (FBFM) Associations across the State of Illinois. Without their cooperation, information as comprehensive and accurate as this would not be available for educational purposes. FBFM, which consists of 5,700 plus farmers and 60 professional field staff, is a not-for-profit organization available to all farm operators in Illinois. FBFM staff provide counsel along with recordkeeping, farm financial management, business entity planning and income tax management. For more information, please contact the State FBFM Office located at the University of Illinois Department of Agricultural and Consumer Economics at 217.333.5511 or visit the FBFM website at www.fbfm.org.