By Carl Zulauf
Department of Agricultural, Environmental and Development Economics
Ohio State University
Gary Schnitkey and Nick Paulson et.al
Department of Agricultural and Consumer Economics
University of Illinois
The 1981 farm bill made a policy mistake that may inform the next farm bill. It raised support prices under the assumption that high commodity prices and high inflation would continue into the future. Instead, both declined as demand for farm commodities softened and the Federal Reserve raised interest rates to reduce inflation. As a result, support prices were too high, leading Congress to reduce them in the 1985 farm bill to bring them into line with market prices. Similar to 1981, considerable discussion is currently occurring about the need to raise statutory reference prices in response to higher crop prices, production costs, and inflation. However, unlike the 1981 farm bill, the 2018 farm bill has adjustment mechanisms that allow for higher support prices while avoiding a potential 1981 farm bill trap. We examine these price support adjustment mechanisms in the context of the 2024 farm bill dilemma.
2018 Farm Bill Adjustment Mechanisms
The Agriculture Improvement Act of 2018 included a reference price escalator clause. Specifically, the effective reference price is the higher of (a) the statutory reference price listed in the 2018 farm bill or (b) 85% of the Olympic average (excludes high and low) price for the 5 most recent completed crop years but capped at 115% of the statutory reference price (US Congress, 2018). The price escalator is discussed in-depth in a June 29, 2022 farmdoc daily article.
Like the reference price escalator, the price component of the ARC (Agriculture Risk Coverage) commodity program option is calculated as the Olympic average price for the 5 most recent completed crop years. Both the reference price escalator and the ARC price calculation method allow support prices to move higher should market prices move higher for a period of 2 or more years.
Three important differences exist between the ARC price calculation and the reference price escalator:
- ARC price is not capped. Reference prices are capped at 115% of the statutory reference price.
- ARC price is the higher of a crop’s market year price or its effective reference price. The reference price escalator uses the crop market year price with no substitution.
- Price adjustment factor is 86% for ARC vs. 85% for the reference price escalator.
These differences imply that the ARC price has a higher upside than the effective reference price.
Analysis
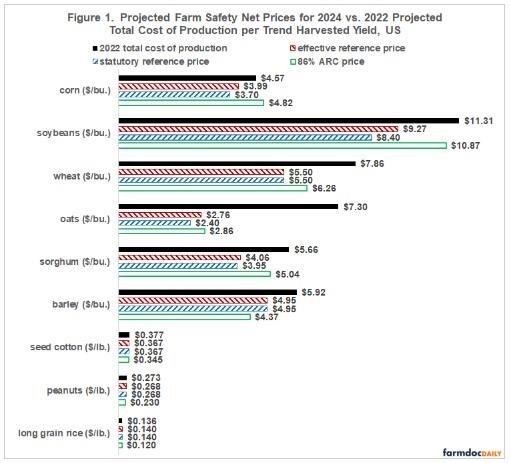
The ARC price and effective reference price are calculated for the 2024 crop year, the first year under the new farm bill. The 5-year price calculation window for both 2024 support prices is 2018-2022. Support prices are calculated for barley, corn, seed cotton, oats, long grain rice, sorghum, soybeans, and wheat. These crops are selected because total cost of production projections are available for the 2022 crop year from US Department of Agriculture, Economic Research Service (USDA, ERS) (see Data Note 1). Cost of production is used as a comparative benchmark for the support prices. Prices for the 2018-2021 crop years are from USDA, Farm Service Agency (FSA). Prices for 2022 are the projected prices in the June 2022 WASDE (World Agriculture Supply and Demand Estimates). (See Data Note 2)
Findings
The relationships between the support prices and total cost of production per unit of output (see Figure 1 and Data Note 3) suggest the 8 crops can be grouped into 4 categories:
- Corn and soybeans have a 2024 ARC price and 2024 effective reference price that exceeds the current statutory reference price. The ARC price is near the 2022 total cost of production per bushel.
- Sorghum, wheat, and, oats have a 2024 ARC that price exceeds both reference prices. The 2024 ARC price, especially for oats, is below the 2022 total cost per bushel.
- Barley has a 2024 ARC price that is below the 2024 effective reference price, which equals the current statutory reference price. All 2024 support prices are below the 2022 total cost per bushel.
- Peanuts, long-grain rice, and seed cotton have a 2024 ARC price that is below the current statutory reference price, which equals the 2024 effective reference price. The statutory reference price is near the 2022 total cost per pound.
Summary Observations
The reference price escalator and especially the uncapped ARC price calculation procedures, provide a way to raise support prices while avoiding the 1981 farm bill mistake of setting support prices, specifically statutory reference prices, too high in anticipation that commodity prices and inflation will remain high.
Both support price adjustment mechanisms are likely to increase support prices during at least some years of the next farm bill for a number of program commodities, especially the ARC price for corn and soybeans.
The 2023 crop year price will be important in writing the next farm bill. Should prices remain high in 2023, market prices will be elevated for at least two years in the support price calculation window for many program commodities, including corn and soybeans, in each of the expected 5 years of the 2024 farm bill.
For corn and soybeans, the 2024 ARC price is near the projected 2022 total cost of production per bushel. For peanuts, long-grain rice, and seed cotton; their current statutory reference price is near their total cost per pound. Caution seems in order for any across-the-board increase in statutory reference prices.
A potential transition assistance issue that may arise is a desire to speed up the increase in support prices given the sharp jump in cost of production. A simple way is to convert the 5-year Olympic average to a 5 year average. This change moves the increase forward by not eliminating the first year of a multiple year increase. It also extend the period of transition assistance by not eliminating the last high year from the calculation window when markets move from a multiple year period of higher revenue to a multiple year period of lower revenue. The trade-off is a smaller largest increase in support price. Cost should thus be similar.
Data Notes
- USDA reports 2022 costs only for all US rice. To estimate long grain rice total cost, all US rice total cost is multiplied by 93.3%, the ratio of average 2021 total cost for regions where long-grain rice is primarily grown (Mississippi River Delta, Gulf Coast, and Arkansas non-Delta) to 2021 US all rice total cost.
- WASDE projects cotton lint, not seed cotton, prices for 2022. It does not present information for peanuts. The 2022 price for peanuts was assumed to be the 2021 price. A seed cotton price projection was calculated by multiplying the cotton lint price projection by 50%, the 2017-2021 average ratio of seed cotton price to cotton lint price.
- Total cost reported by USDA, ERS is divided by the linear trendline harvested yield per acre for 2022 to obtain total cost per unit of output. Trendline harvested yields by crop are barley (75), corn (178), seed cotton (2130), oats (66), long grain rice (7701), sorghum (71), soybeans (50), and wheat (49).
Source : illinois.edu