By Jonathan Coppess
Water on the mind as the last days of a hot and difficult summer fall from the calendar. A recent analysis of water usage raises concerns about the risks to vital water supplies and aquifers (Rojanasakul et al., August 28, 2023). Such risks are particularly acute for cropland irrigation, the primary consumer of water in key areas where water sources were found to be in serious decline. Risks to water and irrigated agriculture implicate food security and supplies, but also the federal crop insurance program. In the Congressional Budget Office baseline projections, crop insurance will cost over $100 billion in the next ten fiscal years (or about $10 billion per fiscal year) and more than 80% of the costs are for the federal assistance to farmers to reduce insurance premium costs (CBO, May 2023; farmdoc daily, May 18, 2023; February 23, 2023). This article continues the series on policy design for the farm bill with a review of crop insurance.
Background
This article continues the series exploring the major mandatory titles, policies, and programs in the Farm Bill, as well as providing updates on development of the Policy Design Lab, a web-based resource in which to explore and analyze policies (see, farmdoc daily, April 13, 2023; May 11, 2023; June 8, 2023; August 24, 2023). The goal of the Policy Design Lab is to incorporate and apply research, publicly available data, and computational resources for analysis and visualization of federal agricultural policies, guided by statutory provisions or legislative options to produce comparative analysis. For each of the major mandatory farm bill programs, the starting point is visualizing the status quo with maps and charts of the distribution of benefits and payments by state.
Crop Insurance has been included in recent farm bills as Title XI in 2014 (P.L. 113-79) and 2018 (P.L. 115-334). Importantly, the federal crop insurance program is permanently authorized and does not need a farm bill reauthorization to continue operation. There is no end or “sunset” date on the authorization of crop insurance; moreover, the Federal Crop Insurance Corporation (FCIC) is a permanently authorized government corporation (7 U.S.C. §1503). Congress has also permanently authorized an insurance fund from which expenses and costs are to be paid, with expenses and costs backstopped further by the Commodity Credit Corporation (7 U.S.C. §1516). In farm bills, Congress typically makes minor changes or tweaks to crop insurance. The 2018 Farm Bill, for example, addressed cover crop termination, hemp, and data collection, as well as adding coverage for specialty crops.
Congress first authorized a federal crop insurance program for wheat in the Agricultural Adjustment Act of 1938, but the program languished for decades with poor participation and high losses. Arguably a low point for the program was in the 1990 Farm Bill recommendations by the George H.W. Bush Administration which proposed eliminating the program in favor of standing disaster assistance. Instead of following the Administration’s proposal, Congress continued the program in 1990 and followed in 1994 with the Crop Insurance Reform Act (P.L. 103-354). The 1994 Act increased premium subsidies—the amount of the cost of the insurance policy (premium) paid for by the Federal Crop Insurance Corporation—for buy-up coverage (coverage levels greater than 50%) and farmers responded by increasing the total acres insured significantly. In the Agriculture Risk Protection Act of 2000 (P.L. 106-224), Congress increased premium subsidies further. In addition, USDA introduced revenue insurance policies (prices multiplied by yields) for corn and soybeans in Nebraska and Iowa in 1996 and nationwide by 2003. A decade ago, Dr. Joseph Glauber, the former chief economist at USDA, explored the growth of the program from 1990 to 2011 and noted that revenue insurance had not only taken over much of the crop insurance portfolio for the major crops but was also displacing more traditional price assistance in the Title I commodities programs, such as marketing loans and counter-cyclical payments (Glauber, 2013). He concluded that the “federal crop insurance program has grown remarkably” in the years since the Bush Administration proposed eliminating it and that much of the growth was due to the increased premium subsidies and the introduction of revenue policies (Id., at 487).
Discussion
In 1989, USDA’s Risk Management Agency (RMA) reported combined insurance business of less than 950,000 policies earning premium. Net acres insured were nearly 102 million acres and the total liability was $13.5 billion. Last year (crop year 2022), RMA reported almost 1.2 million policies earning premium, over 490 million acres insured and total liability above $173.5 billion (USDA-RMA, Summary of Business). Looking closer at the data reported by RMA, substantial growth in the acres insured in recent years is attributed to pasture, rangeland and forage (PRF) insurance which is a rainfall index policy that covers nearly 55$% of all U.S. land, not just private farmland (RMA, “Pasture, Rangeland, Forage”). Figure 1 illustrates the acres insured as reported by RMA back to 1989: total reported acres (blue); total acres minus PRF (green dash); and total acres of the major commodities by the Title I payment programs (red dash/dot). Even removing PRF acres, total acres insured have more than doubled since 1989 (101 million in 1989 to 239.6 million in 2023), and the total acres insured of the major program crops has gone from 97 million in 1989 to nearly 228 million in 2023. By comparison, the Farm Service Agency (FSA) reported over 242 million base acres enrolled in ARC and PLC in 2022 (USDA-FSA, ARC/PLC Program Data), the Economic Research Service (ERS) reported 330 million acres of total cropland used for crops in 2022 (USDA-ERS, Major Land Uses), and the National Agricultural Statistics Service (NASS) reported 318.7 million acres planted to the field crops (including potatoes) in 2023 (USDA-NASS, Quickstats).
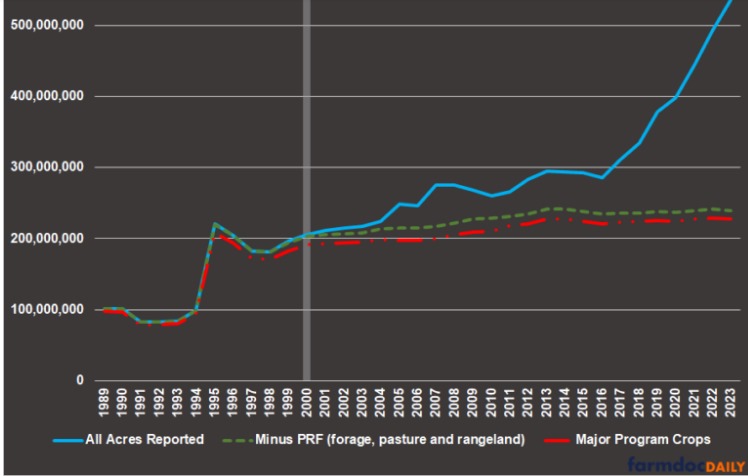
Figure 2 is an excerpt from the crop insurance statute from the Office of the Law Revision Counsel, highlighting the basic authorization for crop insurance coverage (7 U.S.C. §1508). In general, the FCIC is to offer plans of crop insurance to producers of agricultural commodities, as defined later in the statute (7 U.S.C. §1518). In addition, this excerpt provides that insurance must be purchased from an “approved insurance provider” or FCIC if not available from a private insurer. This is the public-private partnership model for federal policy. For additional coverage (i.e., insurance coverage above the catastrophic or 50% loss level), the producer can purchase insurance on an individual yield and loss basis, an area yield and loss basis, or an individual yield and loss basis supplemented by area yield and loss. Producers can also purchase insurance based on margins and insurance levels are not to exceed 85% of the individual yield or 95% of the area yield. More detail about operation of crop insurance has been covered recently in relation to a specific proposal for altering crop insurance (see, farmdoc daily, June 27, 2023).
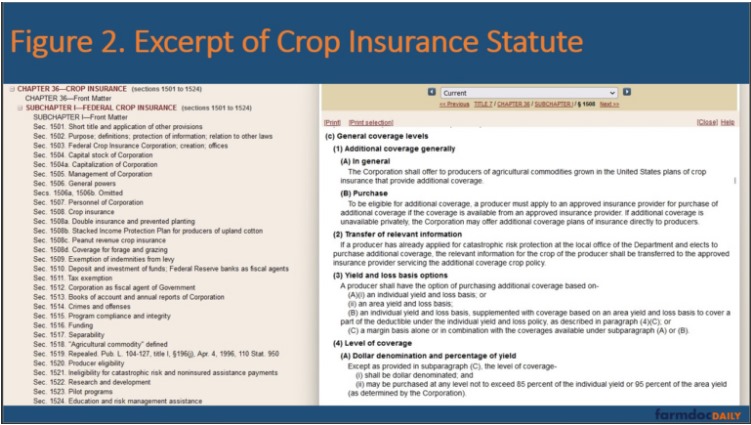
Figure 3 provides an interactive map and other data visualizations for crop insurance as developed by the Policy Design Lab. The initial map displays the total net farmer benefit from crop insurance by state for the 2018 to 2022 years. Total net farmer benefit is calculated from the data reported by RMA’s summary of business reports (USDA-RMA, Summary of Business). Specifically, the net farmer benefit is calculated as the difference between the total indemnities received by farmers from insurance policies in the state and the total amount of premium paid by the farmers for those insurance policies. RMA reports total premium and total premium subsidy with the farmer-paid portion of the premium equaling the total premium minus total premium subsidy. Hovering over a state will produce the total net farmer benefit from 2018 to 2022.
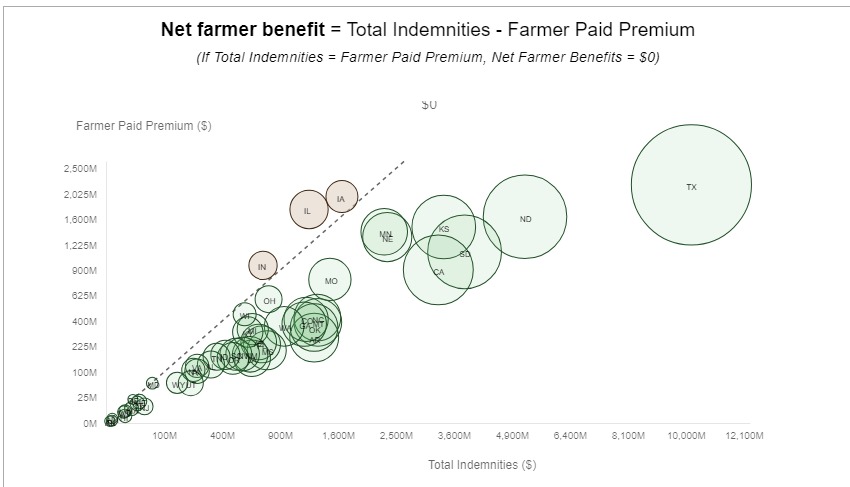
Figure 4 presents additional information for crop insurance. Directly below the map is a bubble chart visualization of the net farmer benefit calculation by state. Hovering over a State’s bubble provides the net farmer benefit calculation in that state. It also divides the states between those in which farmers receive a net farmer benefit and those in which they do not. Combined, the map and bubble chart make clear certain important facts about the crop insurance program. Farmers in Iowa, Illinois, and Indiana have not received net farmer benefits on average from 2018 to 2022. In other words, those farmers have paid more into the crop insurance program than they have received from indemnities and premium subsidy. This is a critical feature of crop insurance as compared to the Title I commodities programs. It is also critical to the operation of an insurance program.
In addition to the map and bubble chart, Figure 5 visualizes the total premium reported by RMA as a combination of the farmer-paid premium and the premium subsidy for each state. In terms of the insurance program, the total premium is the insurance pool from which indemnities are made to farmers when there are approved losses. In addition to these three key visualizations of crop insurance, the website also allows users to select additional data visualizations, adjusting the map for total indemnities and the premium data, as well as average liabilities insured and average acres (including acres in pasture, rangeland, and forage insurance).
One final visualization is also critical to the crop insurance program. Users can select the loss ratio tab and the map will adjust with a table below. The loss ratio is calculated as the total indemnities divided by the total premium for each state. By law, RMA and the FCIC must operate the entire crop insurance program (all states, territories, crops, and policies) to achieve actuarial soundness (7 U.S.C. §1506). Actuarial soundness is a loss ratio of 1.0 (or 100%) or less, meaning that for each dollar paid out in indemnities there is a dollar of total premium in the insurance pool. It also generally means operating enough below 1.0 to provide a reserve. The loss ratio is an important metric for crop insurance. States with high loss ratios are higher risk, triggering more indemnities than total premium. Such states, crops, and risks could impact the soundness and integrity of the program over the long run. Loss ratio has been discussed previously and will be explored further in future articles (see e.g., farmdoc daily, March 27, 2023; January 17, 2023; July 26, 2022; July 5, 2022).
Source : illinois.edu