By Bradley Zwilling
Illinois FBFM Association and Department of Agricultural and Consumer Economics
University of Illinois
Agricultural assets on a nominal basis in Illinois has been increasing on average five percent since 1991. Data from the United States Department of Agriculture (USDA) and Illinois Farm Business Farm Management (FBFM) are shown to see if increasing asset and debt levels pose problems for the financial health of Illinois farms. In the February 18, 2022 farmdoc daily article we looked at increasing debt levels, however the debt to asset ratio was not increasing at the same rate. This study looks to evaluate the asset side of the ratio and the impact on debt levels. Measuring these values overtime becomes of greater importance with more variability in the farm economy and rising inflation.
Overall Agricultural Asset Levels
USDA publishes estimates of total agricultural assets in the United States (see Economic Reporting Service, USDA website). This series is available from 1960 onwards and gives the amount of agricultural assets outstanding as of the year-end.
Nominally, agricultural assets where high in 1980 at $1,000 billion (see the nominal line in Figure 1). From 1980 through 1988, agricultural assets were decreasing due to lower values of machinery and land due the farm crisis in the 1980s. Debt levels at this time were also decreasing. By 1988, agricultural assets had declined by 22% reaching a level of $789 billion.
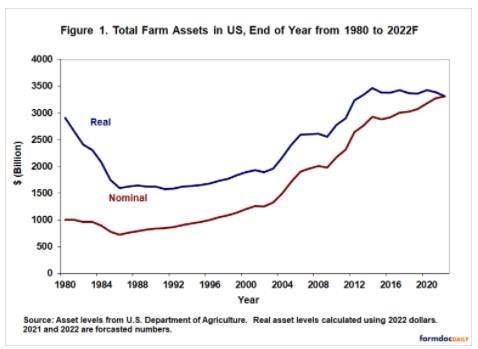
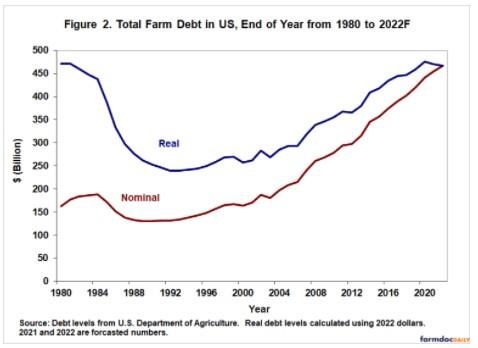
Since 1988, agricultural assets increased on average 4.4% per year. Agricultural debt levels increased on average of 4.0% (see the nominal line in Figure 2) per year in this same period. The rate of increase of assets varied from year-to-year but exhibited no escalating or decreasing trends, except from 2003 to 2006 where assets increased on average 13% per year. The highest rate increases occurred between 2003-2006 and 2011-2012 when increases were 12.8%, 14.6%, 11.5% and 13.8%, respectively. Increases of less than 3% occurred twelve times in this period while decreases happened in 3 years with the greatest at negative 1.7% in 2014-2015.
At the end of 1996, agricultural assets reached $1,003 billion, surpassing the previous high set in 1980. Increasing asset levels are good for agriculture as long as it is gradual. The above asset levels are stated in nominal terms and do not take into consideration inflation’s devaluing impacts on the dollar.
Using the gross domestic product – implicit price deflator to state nominal asset levels in terms of 2022 dollars gives a different picture of asset levels (see the real line in Figure 1). In terms of 2022 dollars, agricultural assets started at $2,906 billion in 1980 before declining until 1992. Since 1992, agricultural assets in real terms increased all but five years 2002, 2009, 2015, 2018 and 2019 (and forecasted decreases for 2021 and 2022). Since 1992, the rate of increase averaged 2.8% for real asset levels (2.4% for real debt levels), lower than the 4.4% nominal rate increase. The number for 2014 is the highest level in real terms ever.
Asset Levels on FBFM Grain Farms
Additional perspective on assets can be obtained by analyzing farm level data from FBFM. Table 1 presents average data for grain farms enrolled in FBFM who have certified-useable balance sheets. The data is stated in nominal terms and are as of year-end 1991 through 2020. Three measures are presented in Table 1: debt-to-asset ratio, debt per tillable acre, and assets per tillable acre.
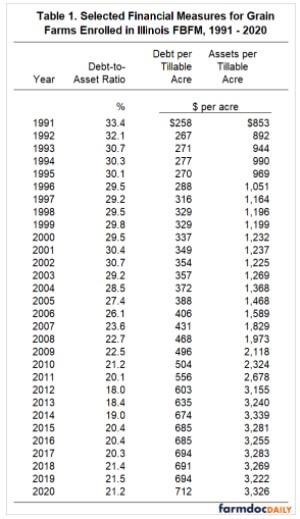
Increases in assets can be seen by examining assets per tillable acre. Asset levels were $853 per tillable acre in 1991 compared to $1,589 in 2006, an increase of almost 90 percent (see Table 1). From 2006 to 2021, levels per tillable acre increased on average 12.2% per year, or $1,566 per acre in 6 years. However since 2012, Illinois FBFM grain farms assets per tillable acre increased on average 0.7%, lower than the national average of 2.4%. Some of the difference could be increase in acres faster than the increase in assets on Illinois grain farms. If you look at the most recent period from 2014 to 2019, 4 of the 5 years have had a negative increase in assets.
Summary
The importance a farmer puts on monitoring financials continues to be increasingly important in this period of rising inflation. With higher inputs and variability, we will continue to see the increase in debt per acre. Over the last five years, debt per acre has increased at a higher percentage than assets per acre. This is primarily due to having 3 out of the last five years for assets per acre showing a slightly negative increase. The higher percentage increase in debt per acres is leading to the debt to asset ratio to increase marginally. With total assets per acre almost four times what it was 30 years ago, debt per acre has only increased about three times during that same period. Careful evaluations of asset values are needed to make sure we understand the fair market value (FMV) and how variable that can be. Rapid increases in FMV, can lead to unearned increases in net worth that can quickly disappear as well if asset values decrease. If we see rapid increases in farm assets, it is better to gradually increase those values on your farm over time. Establishing or maintaining good recordkeeping during these times will help farmers identify areas of concern faster and be able to make better farm financial decisions.
The author would like to acknowledge that data used in this study comes from farms across the State of Illinois enrolled in Illinois Farm Business Farm Management (FBFM) Association. Without their cooperation, information as comprehensive and accurate as this would not be available for educational purposes. FBFM, which consists of 5,500 plus farmers and 65 professional field staff, is a not-for-profit organization available to all farm operators in Illinois. FBFM field staff provide on-farm counsel with computerized recordkeeping, farm financial management, business entity planning and income tax management. For more information, please contact the State Headquarters located at the University of Illinois Department of Agricultural and Consumer Economics at 217-333-8346 or visit the FBFM website at www.fbfm.org.
Source : illinois.edu