By Gregg Ibendahl
Department of Agricultural Economics
Kansas State University
Introduction
Starting around Memorial Day, the USDA collects weekly crop conditions. These estimates continue until harvest. The crop is rated as either: very poor, poor, fair, good, or excellent. These estimates are reported on Monday afternoons based on reports collected from the prior weekend. With only a few days between reporting and publication, this data is some of the most current data available from the USDA. As of 2022, the USDA was collecting crop conditions from 43 states. There are crop condition reports going back to 1986.
With such a large and timely dataset of information, it seems natural to try and predict final yields based on the crop condition reports. Some work has already examined this possibility as detailed below. This article builds on that work to estimate final corn production from the top 18 corn producing states in the U.S. According to the USDA, these 18 states planted 92% of the 2021 corn acreage. The results include the expected corn production from each state as well as the confidence interval for that estimate. To produce an estimate of corn production, both expected yields and harvested acres are estimated. The model presented here is unique as a national corn estimate is based on predicting each state’s corn acres and yield per acre from a 30-year timeline of data from a specific week during the year. The individual state estimates are then combined into a national estimate.
Background
Bain and Fortenbery (2013) have a model that is the basis for the yield predictions in this paper. Their model used an index of crop condition reports to estimate crop yields. The index is constructed by a weighted average of the crop conditions where each crop condition has a point value. Ibendahl (2022) used the Bain and Fortenbery model to estimate wheat yields during each week of the 2022 wheat growing season. His estimates tracked closely to the NASS estimate and the Wheat Quality Council estimate.
Irwin and Good (2017) examined the accuracy of models that estimate yields based on crop conditions. Their yield estimation model used the percent of corn in the good and excellent categories as a predictor of final yield. Irwin and Good found the crop condition model works well for predicting yields during the latter part of the growing season. However, the very early reports have low predictive power. Ibendahl found the same issue with his model as the very early wheat prediction models have low R-squared values.
Procedure
The Bain and Fortenbery model uses all five of the crop condition values in the construction of an index (CCIndex).
CCIndex = (% acreage Excellent) * 1 +
(% acreage Good) * 0.75 +
(% acreage Fair) * 0.50 +
(% acreage Poor) * 0.25 +
(% acreage Very poor) * 0
Because the crop conditions are mutually exclusive, the sum of the percent of acres across the five categories must total to 100 percent. Thus, possible index values range from 100 (if all the crop acres are excellent) down to 0 (if all the crop acres are very poor). A value of 50 would indicate the average crop condition for the state is in fair condition. The USDA provides data at the state level but not at the crop reporting district level.
In this analysis, the crop condition report for a specific week are used to construct a CCI index for the last 30 years. The USDA labels the estimate from 7/17/22 as the week #28 estimate of crop conditions. In the model, the crop conditions for week #28 for the last 30 years are the basis of the yearly CCIndexes. These CCIndexes are then used in a regression analysis to estimate the deviation from trend line corn yield. Each state is estimated individually and the yield per acre confidence interval for each state is also calculated. Because the yield estimate is based on a specific week, the model has to be rerun for each week of the growing season. That is, an analysis of the crop growing conditions next week will produce a different set of parameters than the current week as the CCIndex changes from week to week for both the current and historical years.
To estimate corn production in each state, an estimate is needed of the harvested acres as well. In this analysis, the percentage of corn in the very poor category is used to estimate the percent of corn acres from the June crop report that are harvested. This harvested acre estimate is calculated for each state every week to match the estimate yield per acre. Like the crop conditions, the corn in the very poor category for week #29 from the last 30 years is used in the regression analysis of acreage prediction. The acreage part of the model produces an estimate of the percentage of USDA June crop acres that are harvested. Ibendahl found this metric worked well for estimating harvested wheat acres in Kansas where very poor wheat would often be torn up and planted into a spring crop.
Results
Figure 1 is a Likert graph of the corn crop conditions for the last 20 years in the U.S. (The USDA provides a U.S. number in addition to the individual state numbers). The Likert graph is centered on the fair category to make comparisons among years easier. The number along the left-hand-side of the figure is the total of the very poor and poor categories while the number along the right-hand-side is the total of the good and excellent categories. As can be seen, from a U.S. perspective, the state differences tend to balance themselves out which results in many years looking similar. 2012 is the obvious outlier in the group with 45% of the corn in the poor and very poor categories. The current 14% of this year’s corn in the poor and very poor categories appears to be about average.
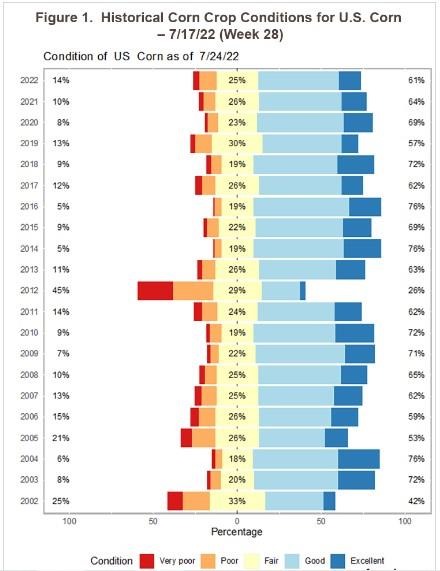
Table 1 shows the estimated yield per harvested acre prediction along with the confidence intervals for each state as of 7/24/22 (week 29). Because this estimate is based on 30 years of observations from week 29, the R-squared values are lower than they will be later on in the year. A lot can happen to either increase or decrease corn yields at this point and the model reflects that variability of final yield.
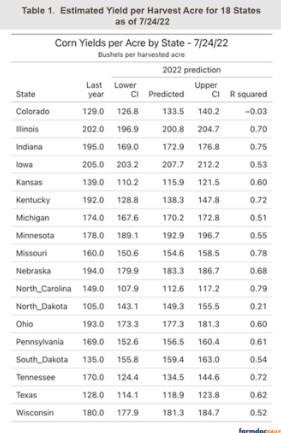
Table 2 shows the estimated harvested acres for each state using the percent of corn in the very poor category as of week 29. Like the yield prediction, the harvested acre prediction is based on the last 30 years of data using June reported acres to predict harvested acres. This part of the model doesn’t fit as well as most corn acres will be harvest in the main corn belt. It is the less productive corn states and states with beef production where harvested acres can vary. In Kansas for example, more corn may end up as silage in lower yielding years.
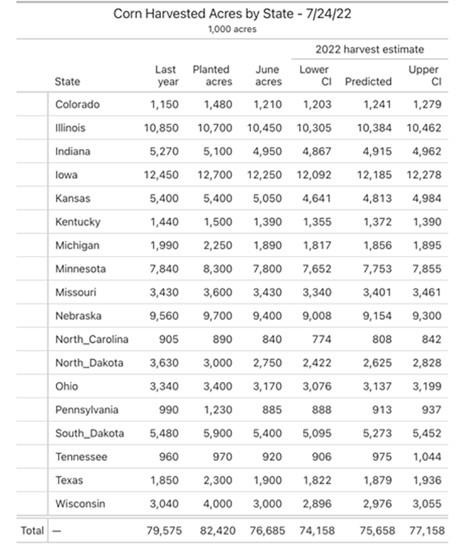
The current harvested acre estimate is for 75.658 million acres from the 18 biggest corn states with a range from 74.158 to 77.158 million acres. A harvest of 75.658 million acres would represent a 4.92% decline from last year.
Table 3 shows the estimated corn production by state and is produced by multiplying Table 1 and Table 2 together. The current estimate is for 13.310 billion corn bushels from the 18 biggest corn states with a range of 12.751 billion to 13.883 billion corn bushels. Corn production of 13.310 billion bushels from these 18 states would represent a 5.65% decline in corn production from last year.
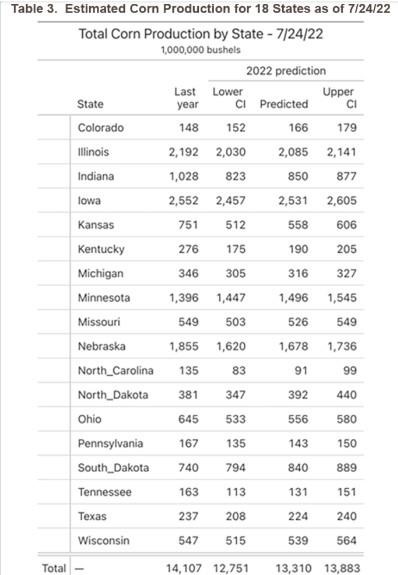
Table 4 projects the 18 leading corn states acres and production into a national total for acres and production. To get the national totals, the acres and corn production from the 18 major corn states are compared to the harvested acres and production from those same 18 states last year. These percentage changes are then used to adjust the national harvested acres and production from last year. These national projections thus assume that the same changes in the 18 major corn states apply to the other corn states.
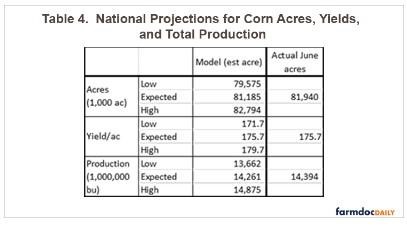
Because the yield per acre from the individual states can’t be summed together, the shown yield per acre is calculated from the total production divided by the total harvested acres. As the table indicates, total production is expected to be 14.261 billion bushels with a range from 13.662 to 14.875 billion bushels. Harvest acres are expected to be 81.185 million acres with a range from 79.575 to 82.794 million acres. These numbers are all calculated using estimated harvested acres as a function of the June acres.
The last column in Table 4 has the actual June acre numbers from the USDA. This number (81.940 million acres) assumes harvested acres equal the June estimated acres. If the USDA June acreage numbers from the 18 corn states were adjusted to a national June number using the procedure described above, the national June corn estimated acres would be 82.287 million acres. Thus, the USDA is projecting the 10% of corn acres not in the 18 major corn states to decline more than the major corn states.
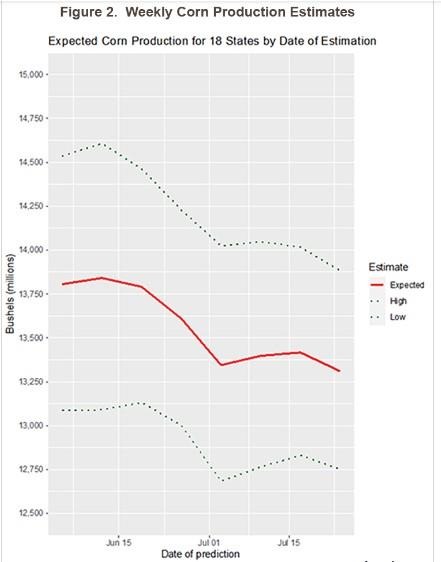
Figure 2 shows how the model prediction has changed during the growing season. As noted by Irwin and Good, the earliest estimates probably tend to overestimate yields. The current year estimates would reflect that tendency. Also, the earliest estimates tend to have lower R-squared values which results in larger confidence intervals. This again can be seen in the figure as the two dotted lines (upper and lower confidence limits) become closer together. The estimates shown switch from using planted acres to model production to using the June crop report once that became available.
Other Points
The model based on the last 30 years doesn’t have too many bad years that become part of the estimation (2012 being the exception). As a result, the model is likely to overestimate the predicted production in a really bad year. Ibendahl tested this idea and estimated 2012 production based on the 30 years previous to 2012. The model for mid-July gave an estimate that was above the final production for 2012 but the final yield was just slightly below the lower confidence interval.
Source : illinois.edu