The past half-century has witnessed tremendous change in farm employment, and it remains foundational to the economy in many rural regions. Farm employment—the number of workers engaged in the direct production of agricultural commodities, either livestock or crops, whether as a sole proprietor, partner, or hired laborer[1]—accounted for nearly 4 million jobs in 1969 or 4.4% of total U.S. employment.[2] By 2021, farm employment generated almost 2.6 million jobs or 2.2% of total U.S. employment. These trends resulted from the greater use of labor-saving technologies and ongoing farm consolidation, among other factors.
This brief uses U.S. Bureau of Economic Analysis (BEA) data to illustrate changes in U.S. farm employment since 1969, with a focus on the geographic consequences of these trends. We first examine broad regional (i.e., multi-state) trends in farm employment. We then consider how agricultural employment has changed at the county level during this period. We conclude by highlighting several consequences, particularly for rural communities, resulting from these half-century changes in farm employment.
The Most Significant Declines in Farm Employment Occurred in the Southeast and Midwest
Overall, U.S. farm employment has declined 35% percent since 1969. Figures 1A and 1B show the absolute and relative changes in farm employment, by broad multi-state region[3], over the past half-century. In 1969, the Southeast (31.6% of total U.S. farm employment), Plains (19.7%), and Great Lakes (16.3%) regions accounted for almost two-thirds of total U.S. farm employment. These regions have also experienced the greatest absolute and relative declines in farm employment in the past 50 years, and by 2021 these three regions’ combined share was down to less than 55% of the total.
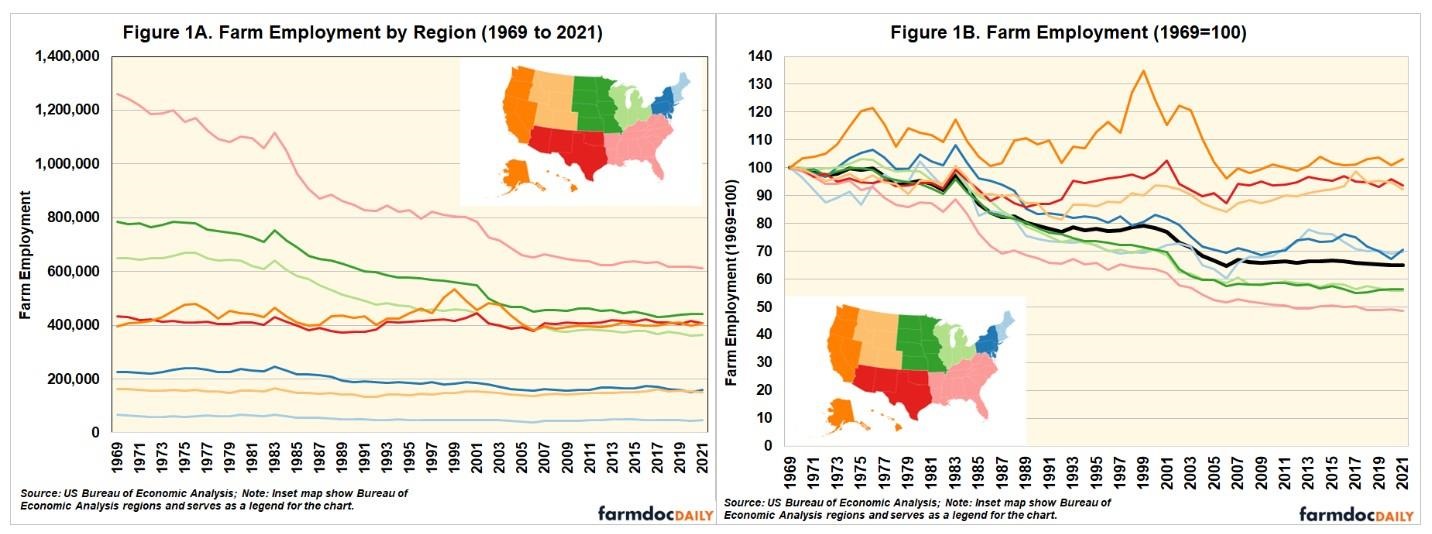
The Southeast region had 612,000 farm jobs in 2021—down from almost 1.3 million in 1969. During this period, the population of the Southeast grew significantly and, as a result, the region became more urbanized and less reliant on agriculture. These developments change the region’s relationship with agriculture, as fewer people are now directly connected or exposed to agriculture. Consider that in 1969, the Southeast region had 35 people for every farm job; by 2021, there were 140 people per farm job. The region remains an important agricultural region, however, with almost 1 out of every 4 farm jobs in 2021.
Farm employment has also declined significantly in the broader Midwestern region. Combined, the states in the Great Lakes and Plains regions lost almost 45 percent of their farm employment (roughly 630,000 jobs) since 1969. Despite these losses, the Great Lakes and Plains states still have a combined 805,000 farm jobs—almost one-third of the nation’s farm employment in 2021. These changes were brought about through greater use of labor-saving machinery and technology and a shift toward larger farms through consolidation that have transformed common midwestern farm activities like corn and soybean production.
Unlike the Southeast, which experienced significant population growth, the farm employment declines in parts of the Plains and Great Lakes corresponded with depopulation throughout many rural parts of these regions. In some of the more rural parts of the country’s agricultural heartland, county populations peaked in size during the 1940s and 1950s (Johnson and Lichter, 2019). Especially in the traditional Midwestern states, the simultaneous decline of agricultural and manufacturing jobs contributed to these population losses. Nevertheless, agriculture remains a foundational regional activity in these Midwestern regions. This is especially in the relatively less populated Plains region, where there were 49 people for every farm job in 2021 (up from 21 in 1969). In North and South Dakota, farm employment represents 5.2% of total employment which is greater than in any other state.
Farm Employment Does Not Decline Everywhere, All the Time
Although farm employment may represent a declining share of total employment, these declines are not always accompanied by dramatic net employment losses. Recognizing that there are year-to-year variations, agricultural employment has remained relatively steady in the Far West, Rocky Mountain, and Southwest regions over the past 50 years. In 2021, the Southwest and Rocky Mountain regions had farm employment levels that were within 8 percent of their 1969 employment. Indeed, the Far West states had three percent more farm employment than they had in 1969. Perhaps more consequentially, these regions combine to account for half of all U.S. population growth over the past half-century. Moreover, agricultural activities in the West—especially in the Far West—often involve more labor-intensive activities (e.g., produce, grapes). The types of farm jobs differ from other parts of the country. For example, farm laborers account for a greater share of overall farm employment; farm proprietors represent only 32.6% of total farm employment in the Far West states compared to 68.7% nationally.
The regional variations in farm employment show that job losses do not occur everywhere, all the time. Since 2006, farm employment in the United States has increased by 9,000 jobs. The Southwest (+27,700), Rocky Mountain (+13,200), and Far West (+26,800) all had net farm employment gains between 2006 and 2021, which helped offset farm employment decline in the Southeast (-39,700), Great Lakes (-19,000) and Plains (-9,000) regions. During this same period, there have also been modest farm employment gains in the New England (+6,200) and Mideast (+2,800) states. These regions make important contributions to U.S. agriculture (e.g., New York dairy), but combined, these Northeastern states consistently represent a relatively smaller share of U.S. agricultural jobs (7.0% in 1969, 7.7% in 2021). Within these regions, the more recent farm employment growth is likely the result of growing national interest in local food production over the past two decades (Low et. al., 2015).
Local Growth and Development Influence the Geography of Farm Employment
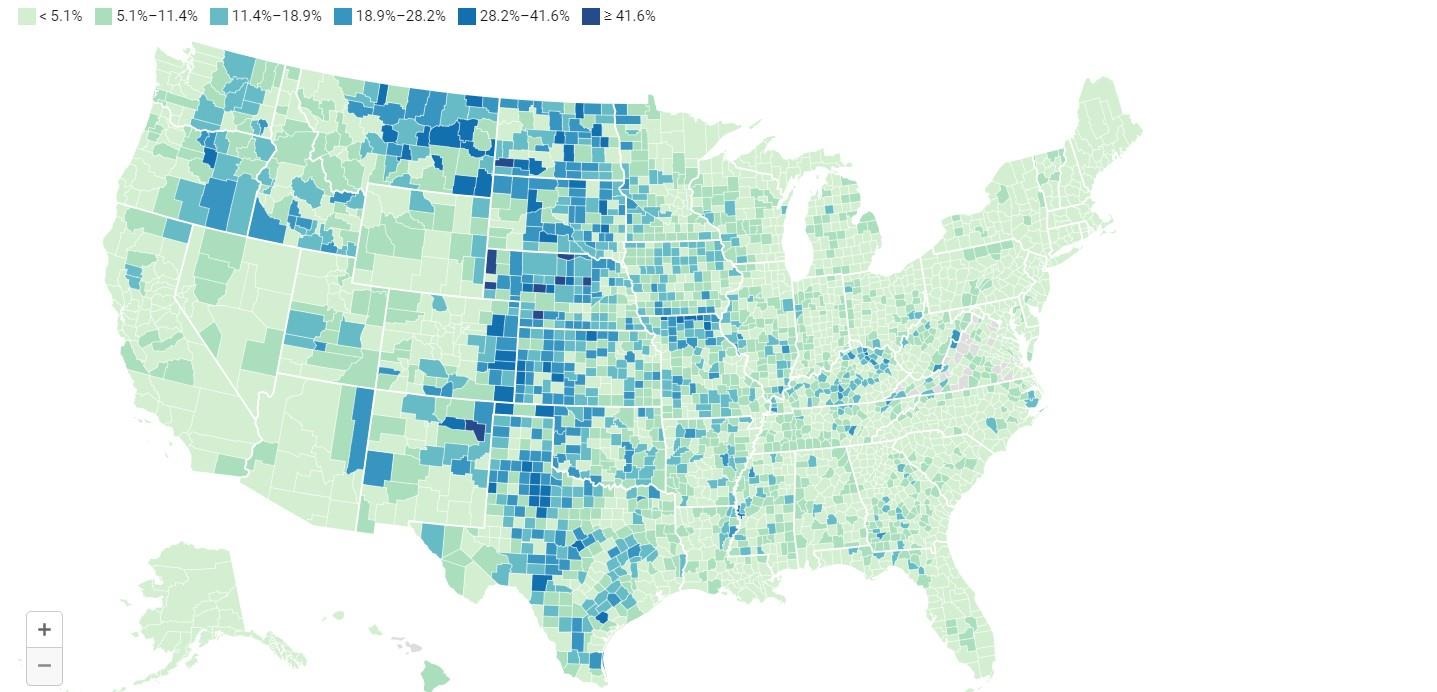
Broad regional changes only tell part of the story. Figure 2A shows how farm employment has changed—as a share of total county employment—for each year between 1969 and 2021; Figure 2B shows the same for 2021, with additional information contained within the graphic. Many of these changes mirror the trends displayed at the broader regional level, but there are also significant changes that occur more locally within these regions.
Figure 2A. Farm Employment as A Share of Total County Employment (1969-2021)
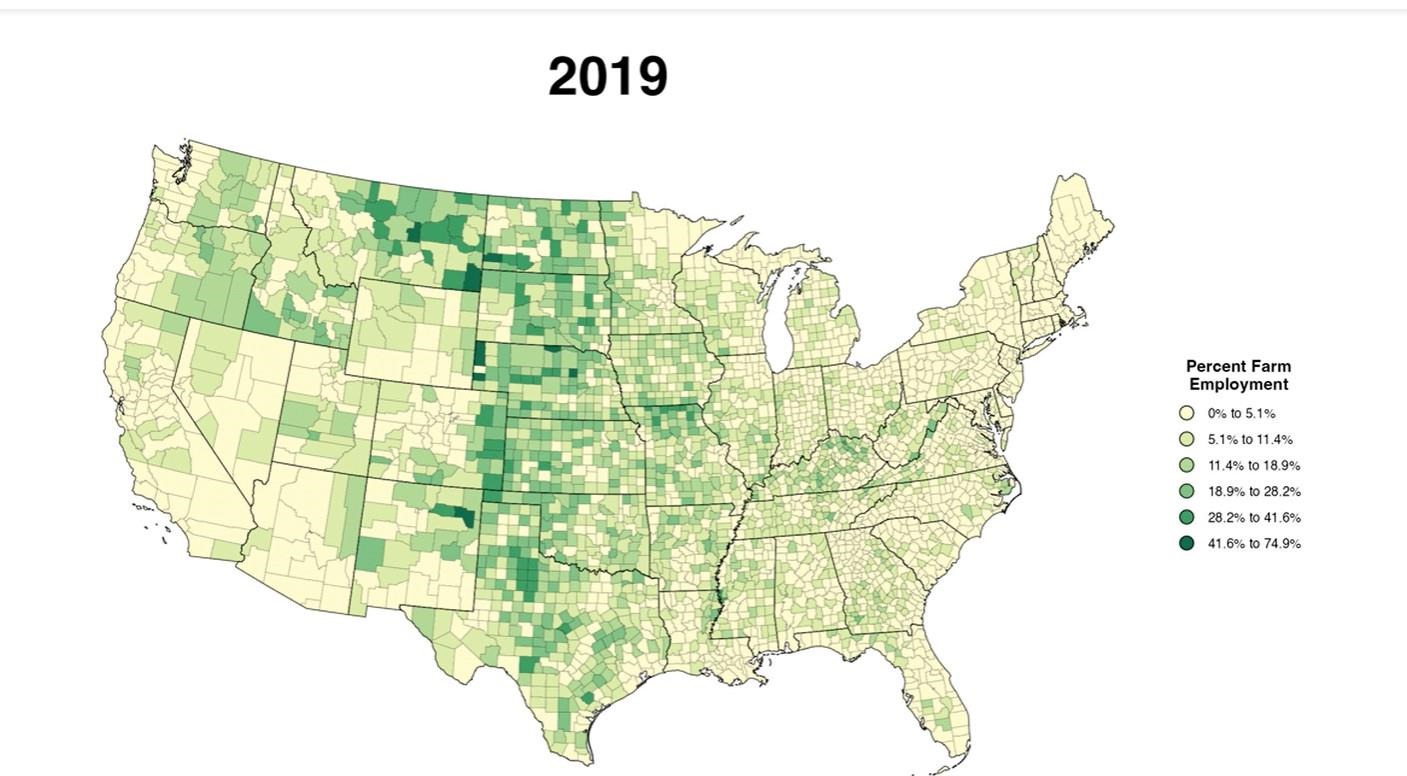
The expansion of major urban areas underlies many local changes. For instance, farm employment as a share of total employment has declined dramatically in places like North Georgia around Atlanta, Middle Tennessee around Nashville, and Northwest Arkansas, among other places. By contrast, some of the areas that have seen more extensive farm employment growth—particularly over the past 20 years—have been in more rural places like Northern Arizona and New Mexico that are often home to tribal areas.
Agriculture remains an important source of regional employment in the Great Plains (stretching from the Dakotas down through Texas), just as it is a leading source of regional wealth creation (White, 2023). For instance, 7 of the 10 counties nationally with the greatest share of farm employment were in rural Nebraska; in 2021, Sioux County, Nebraska was the only U.S. County where farm employment accounted for more than half of total county employment. Agriculture may have an outsized influence on rural counties, but farm employment can continue to be an important source of jobs in some urban counties as well. For instance, while farm employment as a share of total employment declined in the area around Yakima and Moses Lake in Washington State (Yakima and Grant counties, respectively) over the past 50 years, there were 5,200 and 3,900 more farm jobs in these counties in 2021 than there were in 1969, respectively. In 2021 roughly 1 in 5 U.S. counties had more farm employment than they had in 1969, thereby demonstrating that a decline in relative employment share does not always accompany net losses in farm employment.
These Economic Changes Have Important Implications for Regions and Communities
Over the past half-century, declines in farm employment contributed to rural outmigration and population loss—particularly in communities unable to generate other sources of employment opportunities. The impact of these losses can affect rural communities in many ways. Declining populations can lead to a loss of state and federal representation, which can limit access to resources (Kuethe and Coppess, 2014). Moreover, many federal and state resources are allocated based on population, so fewer people lead to fewer resources. These federal and state resources are often needed to address market failures created by insufficient demand (e.g., gaps in broadband infrastructure). Anderlik and Cofer (2014) found that the continued presence of agriculture in these depopulating areas has given another line of business to rural banking institutions, thereby offsetting the erosion of main street businesses and their associated commercial lending needs.
Agriculture remains a vital economic activity in many parts of the country (White, 2023), particularly in rural America. As agricultural production has changed, so too has the nature and extent of the employment created by these activities. In many areas, farm employment has stabilized since 2006—in part due to a growing interest in local and regional foods, where the barriers to new producer entry are lower than for commodity production. For many workers involved in agriculture, however, farm employment remains seasonal and/or part-time work. Spell, Jacobs, Low, and Krohn (2022) showed that 82% of farm household income came from off-farm sources. Therefore, nonfarm employment opportunities enable many farmers to keep farming and potentially allow their children and neighbors to remain in the area. The fates of many rural communities and agriculture are undoubtedly interconnected in many ways.
Notes
[1] This brief relies on data from the U.S. Bureau of Economic Analysis (BEA), so we use their definition of farm employment. We recognize that this definition does not capture the full range of agricultural activities. There are many other activities (e.g., processing, services, etc.) that support the agricultural sector (for a more expansive definition, see White et al. 2020). Regardless, these data serve as a useful proxy for capturing the direct employment impacts of farming.
[2] We use 1969 as our starting point because it is the first year that U.S. BEA makes county-level data available. The most recent data are from 2021, as BEA will release 2022 data in November 2023. This measure captures both farm workers and farm proprietors (individuals who operate their own farming operations without further organization). Nationally, farm proprietors represent about 70 percent of total farm employment, and this has remained consistent over the past half-century. There are, however, regional differences.
[3] U.S. BEA often publishes data using the following state groupings—New England (CT, MA, ME, NH, RI, VT), Mideast (DC, DE, MD, NJ, NY, PA), Southeast (AL, AR, FL, GA, KY, LA, MS, NC, SC, TN, VA, WV), Great Lakes (IL, IN, MI, OH, WI), Plains (IA, KS, MN, MO, ND, NE, SD), Southwest (AZ, NM, OK, TX), Rocky Mountain (CO, ID, MT, UT, WY), and Far West (AK, CA, HI, NV, OR, WA).
Source : illinois.edu