By Gary Schnitkey
Department of Agricultural and Consumer Economics
University of Illinois
and Carl Zulauf et.al
Department of Agricultural, Environmental and Development Economics
Ohio State University
Last week, we showed that the Supplemental and Enhanced Coverage Options (SCO and ECO) have not triggered payments in Illinois counties as often as might have been expected over the past 8 years (farmdoc daily, July 11, 2023). Today’s article examines the insurance prices and yields that have determined SCO and ECO performance since 2015, using two central Illinois counties – Piatt and Knox – to illustrate.
Insurance price declines during the crop insurance period have generally not been large enough to trigger SCO and ECO payments. Yields relative to the county guarantee have been the main factor in triggering payments from SCO and ECO. Piatt county, where no SCO or ECO payments would have been triggered over the past 8 years, consistently had actual yields above the guarantee each year. Knox county, where ECO payments would have been triggered in 3 out of the 8 years, experienced actual yields below the guarantee in each of the 3 payment years.
Background
SCO and ECO provide farmers with the ability to cover a portion of their crop insurance deductible range. SCO covers from 86% down to the coverage level of the underlying individual insurance plan. ECO covers from either 90% (ECO-90) or 95% (ECO-95) down to 86%. SCO and ECO use the same insurance prices as other insurance products but use county – rather than farm-level – yields. This results in the potential for farm-level losses to occur without triggering SCO and ECO payments, and vice versa. Additional details of both programs have been provided in previous articles (see farmdoc daily, February 27, 2014, November 24, 2020, May 5, 2021, May 6, 2021).
Historical analysis of the SCO and ECO programs suggested that payments would be triggered with relatively high frequency in counties in Illinois. Payments for corn might be expected as often as every 2 out of 3 years for ECO-95, and 1 out of 3 years for SCO (farmdoc daily, December 10, 2020). However, experience with the programs since 2015 has resulted in much lower payment frequencies in most Illinois counties (farmdoc daily, July 11, 2023).
Insurance Prices
Figure 1 shows projected and harvest crop insurance prices for corn from 2015 to 2022, and the percentage deviation of the harvest price from the projected price for each year. For example, the projected price in 2022 was $5.90 per bushel. The harvest price for 2022 was $6.86, or 16% above the projected price. Projected and harvest prices are the same for all counties, so deviations from the projected price impact all counties equally in terms of triggering indemnity payments.
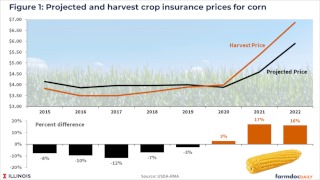
From 2015 to 2019 the harvest price was below the projected price. The deviations from the projected price have not been large enough to trigger SCO payments since 2015 without a county also experiencing yields below the county guarantee. The largest price deviation below projected was 12% in 2017 and, given the 86% coverage level for SCO, at least a 14% decline would be needed to trigger payments if yields are at or above guarantee levels. Price declines in all four years from 2015 to 2018 were large enough to trigger ECO-95 payments (at least 5%), depending on yield experience in a county.
The harvest price for corn was above the projected price from 2020 to 2022, implying a yield loss would be needed in a county to trigger SCO or ECO payments. Note that the most popular form of underlying coverage, Revenue Protection (RP), includes the harvest price guarantee so that yield losses would need to be at least 5% to trigger ECO-95 payments, at least 10% to trigger ECO-90 payments, and at least 14% to trigger SCO payments.
Area Insurance Yields – Piatt County
Figure 2 plots actual and guarantee yields used by the USDA’s Risk Management Agency (RMA) for area insurance plans, including SCO and ECO, from 1996 to 2022 for Piatt County, IL. County guarantee yields were based on a simple linear trend until 2014, at which time RMA made some adjustments to how guarantee yields are set each year.
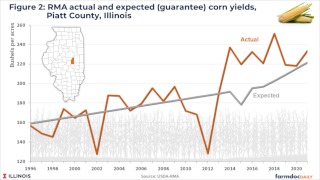
For Piatt county, actual yield has been above the guarantee yield each year since 2013 and no SCO or ECO payments were, or would have been, triggered since 2015. From 2015 to 2019, the Piatt county yield was sufficiently above the guarantee to offset the insurance price declines experienced. For 2020 to 2022, no SCO or ECO payments were triggered because no yield losses occurred for Piatt county.
In 2021, the farmer-paid premium for SCO with 80% RP as the underlying policy was nearly $7 per acre for corn in Piatt county. The farmer-paid premiums on ECO-90 and ECO-95 coverage in 2021 were roughly $11 and $29 per acre, respectively (see the archived 2021 Crop Insurance Decision Tool for SCO and ECO premium quotes). Thus, adding SCO and ECO coverage could involve additional annual premium costs of more than $30 per acre. The underlying 80% RP coverage for a typical farm in Piatt county would have cost around $12 per acre in 2021.
Area Insurance Yields – Knox County
Figure 3 plots actual and guarantee yields from RMA for Knox County, IL. In contrast with Piatt county, the actual yields for Knox county in 2019, 2020, and 2021 were below the guarantee yields for those years.
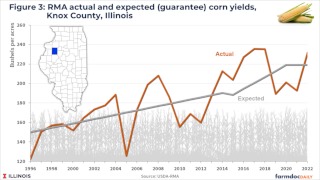
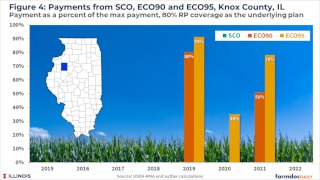
Yield was 11% below the guarantee in 2019. Adding the 3% price decline in 2019 would have resulted in relatively large ECO-95 and ECO-90 payments being triggered for Knox county, while total losses were still not quite sufficient to trigger SCO payments. ECO-90 would have triggered just over $27/acre in payments, and ECO-95 would have triggered just over $69/acre in 2019 in Knox county. As shown in Figure 4, these payments were 80% of the maximum ECO-90 payment and 91% of the maximum ECO-95 payment.
The ECO-95 payment for corn in Knox county in 2020 would have been almost $28/acre, or 35% of the maximum. In 2021, ECO-90 triggered a $24/acre payment (51% of max) while the ECO-95 payment was $83/acre (78% of max).
Farmer paid premiums for SCO, ECO-90 and ECO-95 for corn in Knox county in 2021 were very similar to those reported for Piatt county. Nearly $7 per acre for SCO coverage when added to 80% RP, and roughly $11 and $29 per acre for ECO-90 and ECO-95, respectively. The underlying 80% RP coverage for a typical farm in Knox county would have cost around $12 per acre in 2021.
ECO-95 payments would also have been triggered in 2020, with the Knox county yield being 8% below the guarantee. Both ECO-95 and ECO-90 payments were both triggered in 2021, with actual Knox county yield being 12% below the guarantee.
Discussion
While they provide additional coverage, use of the supplemental insurance programs can also substantially increase a farmer’s total premium cost. Additional premiums can exceed $30 per acre if the farmer adds both SCO and ECO-95 to their individual insurance. Farmers adding SCO and ECO-95 to underlying enterprise unit RP coverage at 80% or 85% coverage levels can easily see their total premium costs more than double. While the premium increase can be partially offset by further reducing the coverage level of the underlying individual plan, the farmer is then trading farm-level coverage for county-level coverage which is inferior from a risk management perspective.
Since 2015, the SCO and ECO programs have triggered payments across Illinois counties less frequently than expectations based on a longer historical timeframe. Variation in county yields across counties has been the main factor in determining whether SCO and ECO payments have been triggered. While the 8-year period from 2015 to 2022 is too short to conclude that SCO and ECO will not perform as expected moving forward, it does call into question use of the programs.
Recent experience can impact farmers’ purchase decisions for crop insurance, so it will be interesting to see how participation in and use of the SCO and ECO products over the next few years compares in counties where payments have or have not been triggered.
Source : illinois.edu