Corn and soybeans planted acreage estimates released by the National Agricultural Statistics Service on Friday, June 30 led to a sharp divergence in new-crop corn and soybean futures prices. Corn acreage estimates exceeded all analysts’ expectations and the December 2023 corn futures price dropped more than 33 cents per bushel on Friday to settle near a one and half year low at $4.95 per bushel. In contrast, soybean acreage was far below analysts’ expectations and the November 2023 soybean futures price rallied, ending the day up a whopping 77 cents per bushel at $13.43 per bushel. On the heels of a six-day slide in both corn and soybean prices on favorable weather and improving yield prospects, Friday’s price action extended losses for corn and reversed price declines in soybeans.
For corn, higher acreage, improved yield prospects due to Corn Belt rain forecasts, and dismal old-crop demand numbers create a burdensome new-crop supply and demand balance. It is hard to envision a scenario where corn prices can increase much from current levels unless we observe poor weather over a wide swath of the US Midwest between now and the fall. For soybeans, the situation is reversed. Fewer soybean acres make the new-crop supply and demand balance look tight unless yields are much poorer or demand weaker than expected.
Going forward, the acreage estimates given by USDA set up fundamental tension between corn and soybean prices. Current USDA price forecasts and post-report futures prices both indicate relative price levels that heavily favor soybeans. That new-crop corn prices fell ‘only’ 33 cents following the report release may be evidence that high soybean prices are supporting a weak corn market. Below I review the acreage numbers in more detail and consider what they mean for new-crop balance sheets. I conclude with thoughts on what might resolve this divergence in corn and soybean markets.
Reviewing the Acreage Numbers
Figure 1 shows numbers for corn and soybean acres from the June Acreage report with historic acreage since 2006 for context. USDA projected 2023 US corn planted acreage at 94.1 million acres. This was up 2.1 million acres from the earlier estimate of 92.0 million acres released in the Prospective Plantings report at the end of March. It far exceeded the average of market analysts pre-report forecasts of 91.9 million acres. If realized, this corn acreage figure would be the third highest since World War II. Corn acreage increases were observed in nearly all major producing states. Illinois corn acreage estimates were up 500,000 acres from 11.0 to 11.5 million acres between March and June.
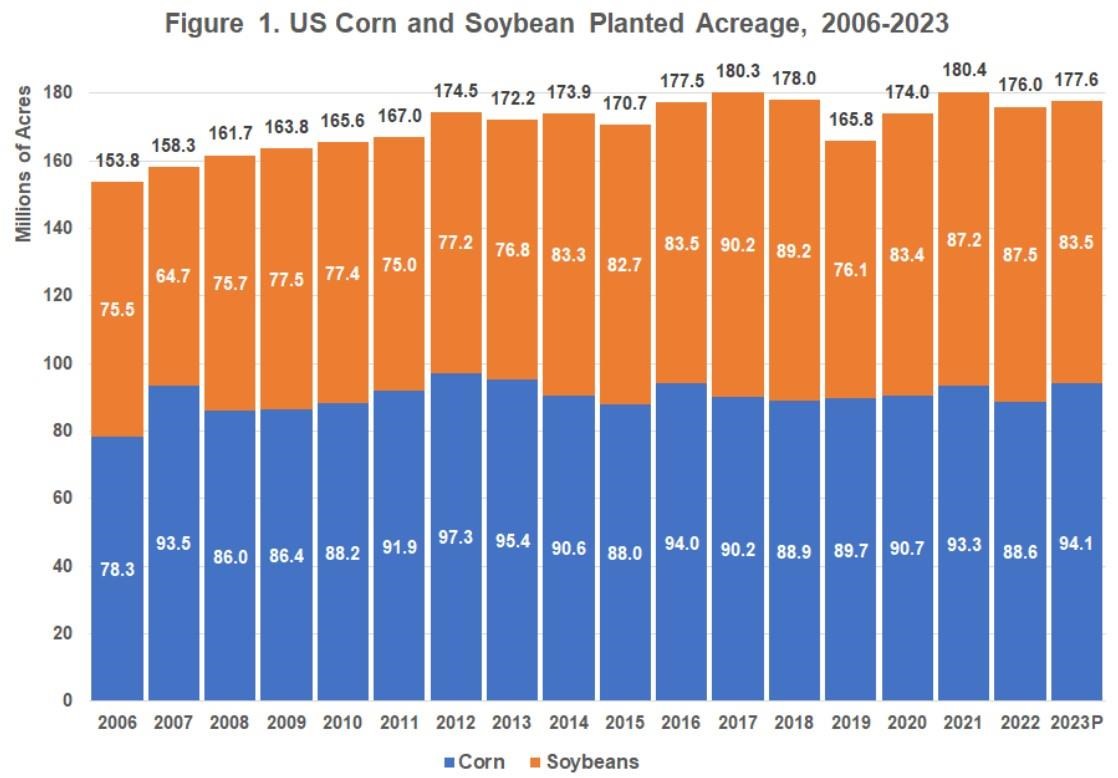
Soybean acres were pegged at just 83.5 million acres. This was down 4.0 million acres from the March estimate of 87.5 million and well below average analyst pre-report estimates of 87.7 million acres. Similar to corn, soybean acreage changes from previous estimates were not concentrated in any particular state or region. Estimates for soybean acres in Illinois were down 800,000 acres from 10.8 to 10.0 million between March and June.
Combined corn and soybean acreage was projected to rise slightly from 2022’s level of 176.0 to 177.6 million acres. The earlier March estimates had combined acres at 179.5. That combined acres did not increase in spite of historically high price levels continues a theme observed in the past decade. The response of aggregate acres (whether corn plus soybeans or all principal crops) to price is somewhat sluggish. Response of aggregate acreage is certainly less responsive that acreage of individual crops.
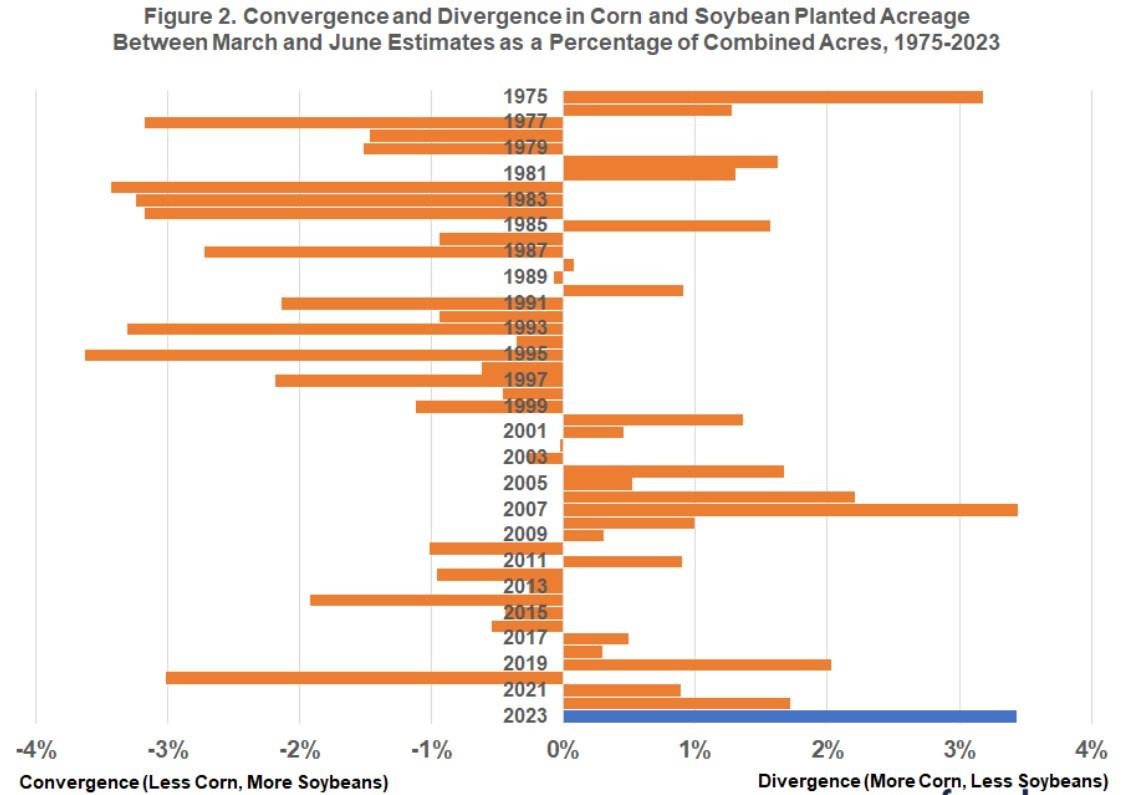
The swing toward corn and away from soybeans is notable in historic terms. Relative to earlier projections in the March Prospective Plantings report, corn and soybean acres diverged by 6.1 million acres (= 2.1 million increase in corn + 4.0 decrease in soybeans). As a percentage of combined corn and soybean acres, this corn-soybean divergence between the March and June acreage numbers is the second largest for which figures are available from NASS online records (since 1975). Figure 2 shows in percentage terms the size of the divergence or convergence in corn and soybean acres between the end-of-March and end-of-June acreage estimates beginning in 1975. Only in 2007, when the US planted a then post-World War II record 93.5 million acres has such a large swing been observed between the March and June reports.
There are several explanations for this massive swing in acres toward corn:
- New-crop price ratios favored corn slightly in the period leading up to planting and moved further in favor of corn by the end of May.
- Relatively mild planting season weather allowed farmers throughout the Corn Belt to plant corn without delays that might have shifted some acres to soybeans.
- The Corn Belt crop mix in 2022 skewed toward soybeans relative to historic acreage splits seen in Figure 1. Crop rotation benefits favor a return to corn.
- Nitrogen fertilizer prices declined from previous years favoring corn, a more fertilizer intensive crop.
- Finally, there is the old saw about the US farmer just flat out preferring to plant corn.
Regardless of the specific causes, higher corn acres and lower soybean acres have big implications for new-crop supply and demand conditions and price movement between now and harvest.
New-crop Balance Sheets
Increasing planted acreage relative to previous estimates for corn and decreasing it for soybeans significantly changes the projected supply and demand balance as measured by the ending stocks-to-use ratio. Table 3 shows a series of supply and demand balance sheets for corn and soybeans for the new-crop 2023/24 marketing year. The first column for each commodity displays the estimates given in the most recent WASDE report released on June 9. These estimates use the earlier acreage projections of 92.0 million acres for corn and 87.5 million acres for soybeans. Corn ending stocks-to-use was projected to be 15.6%. This level was already viewed as burdensome. Historically, corn prices need to be below $5 per bushel to sustain this level of availability. Soybeans stocks were also project to increase year-over-year. The soybean stocks-to-use ratio was previously estimated at 7.9%.
New acreage numbers dramatically change the supply and demand balance in the absence of further changes to yields or use. The second column for each commodity in Table 1 uses the updated acreage numbers and assumes the difference between planted and harvested acreage remains the same. With use unchanged in this scenario, the stocks-to-use ratio increases to 18.2% for corn and decreases to 3.2% for soybeans. This divergence in supply and demand balance would be relatively uncharted territory.
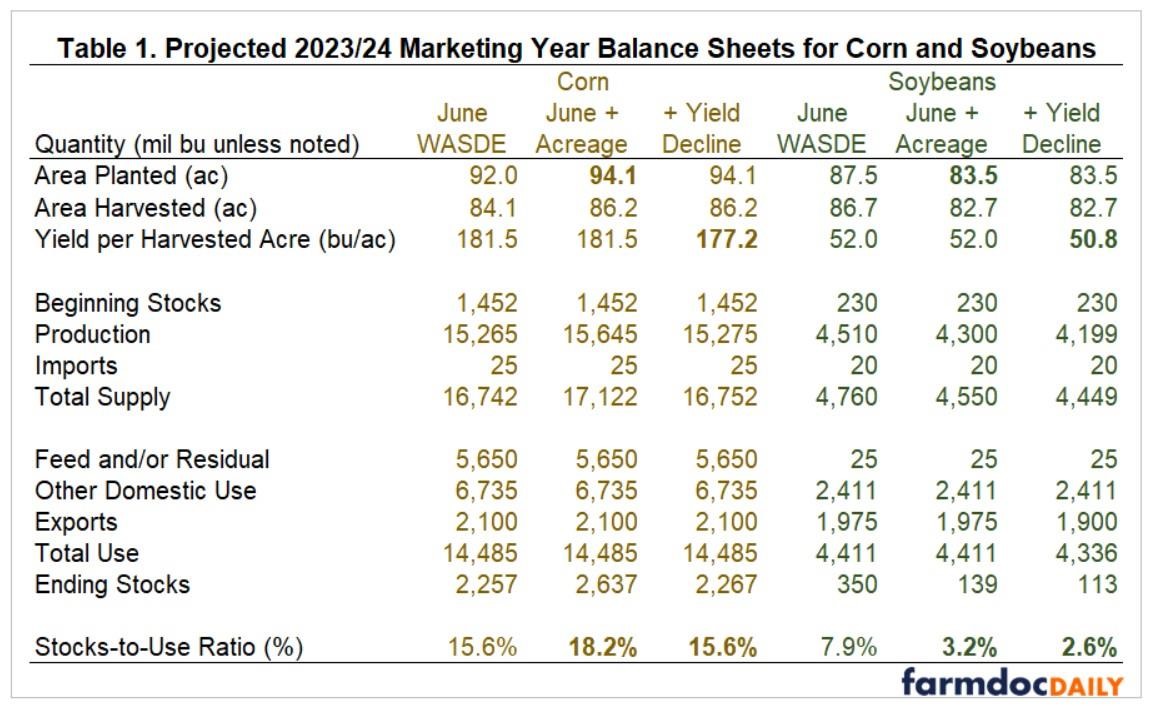
Obviously, much market chatter will continue to center on the effect of weather on yield expectations. Price volatility in June was mainly a function of the lack of rainfall in the Corn Belt. July promises to see the focus on weather news continue. The market will pay considerable scrutiny to yield estimates released on July 12 in the next WASDE report. As a ‘what-if’, the third columns in Table 3 consider the corn yield decrease necessary to get back to the projected stocks-to-use ratio for corn observed in the June report. The soybean yield decrease is proportional to this corn yield decrease. This exercise shows it would take relatively large cut in corn yield of more than four bushels per acre to return to the projected supply and demand balance expected prior to the June acreage report. Any cuts to soybean yield at this point would make a tight soybean supply and demand situation that much more severe.
Discussion
The June Acreage report featured a historically large divergence in corn and soybean acres relative to previous expectations. Markets reacted as one would expect to this news with new-crop soybean prices up and corn prices down. At these new-crop price levels, soybeans are expensive relative to corn. Can this price divergence persist through to harvest? As US acreage is now fixed, there are a limited set of economic responses to the current market situation that would bring corn and soybean prices closer to historic parity conditions:
Source : illinois.edu