By Gary Schnitkey and Jim Baltz et.al
Department of Agricultural and Consumer Economics
University of Illinois
Carl Zulauf
Department of Agricultural, Environmental and Development Economics
Ohio State University
Projected prices used to set 2022 crop insurance guarantees will not be known until the end of February. Currently projected prices are estimated at $5.70 for corn and $13.50 for soybeans. If yields are near trend levels and cash rents are near averages, those prices will result in profitability for 2022. However, losses for 2022 are possible, even if the highest coverage level of crop insurance is used. Risk management suggestions are: 1) Maintain high levels of crop insurance, 2) Consider using supplemental policies, and 3) Price more grain than usual.
Projected Prices
Projected prices used to set revenue guarantees for crop insurance are based on settlement prices of Chicago Mercantile Exchange futures contracts. For Midwest states, the average of settlement prices during February determines projected prices, with the December contract used for corn and the November contract used for soybeans.
At this time, projected prices are not known, as February is just beginning. However, current futures levels provide reasonable indications of 2022 projected prices. The December 2022 corn contract is currently trading near $5.70 per bushel. If futures prices continue at this level through February, the 2022 projected price would be $5.70, higher than last year’s projected price of $4.58 per bushel (see Figure 1). Between 2014 and 2021, projected prices averaged $4.06. Projected prices were near the $5.70 level in the mid-2010s: $6.01 in 2011, $5.68 in 2012, and $5.65 in 2013.
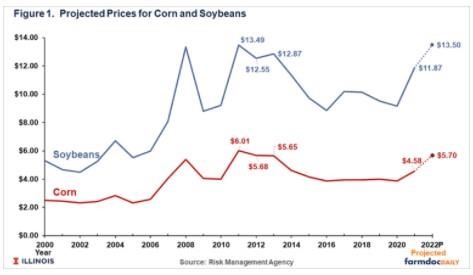
Currently, the November 2022 soybean contract is trading near $13.50 per bushel, indicating that the 2022 projected price could be near $13.50. A $13.50 projected price would be above the 2021 projected price of $11.87 per bushel. Between 2014 and 2021, projected prices averaged $9.86. In the mid-2010s, projected prices were $13.49 in 2011, $12.55 in 2012, and $12.87 in 2013 (see Figure 1).
Cash Guarantees
Higher 2022 projected prices will result in higher 2022 revenue guarantees. At the same time, costs have increased, reducing the risk protection offered by higher guarantees. The joint impacts of those changes are illustrated in Figure 2, which shows cash guarantees, net returns, and break-even cash rents for different coverage levels. These values are calculated for a high—productivity farmland in Central Illinois. Similar results are obtained in northern Illinois, southern Illinois, and other areas of the Midwest.
For corn, non-land costs are estimated at $755 per bushel (see farmdoc daily, December 7, 2021). A cash rent of $305 per bushel gives total costs of $1,060 per acre (see Figure 2). Higher cash rents exist on some farms, resulting in higher total costs. Many farms have Trend-Adjusted Actual Production History (TA-APH) yields of 220 bushels per acre.
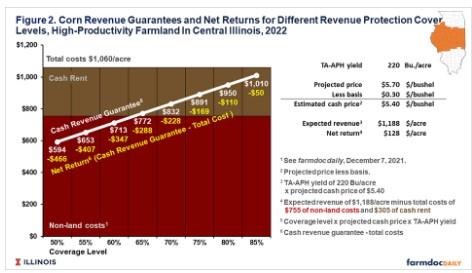
Note that the $5.70 projected price is based on futures prices. Typically, cash prices are lower than futures prices, with an average basis in Illinois being about $.30 per bushel. Therefore, a $5.70 projected price translates to an estimated cash price of $5.40 per bushel (see Figure 2).
The expected revenue is $1,188 per acre (220 TA-APH yield x $5.40 projected cash price). Given $1,060 of total costs, net return is projected at $128 per acre ($1,188 expected revenue – $1,060 costs). These positive net returns would result in high net farm incomes and a profitable year.
There are always downside risks, and crop insurance can be used to protect against downside risks. Guarantee levels are shown in Figure 2 for purchases of Revenue Protection (RP) at different coverage levels.
Figure 2 shows cash revenue guarantees for each coverage level, which restate the RP guarantee in terms of its cash equivalent. RP’s guarantee equals the coverage level times the TA-APH yield times the projected price. In the corn example in Figure 2, an 85% coverage level has an RP guarantee of $1,066 per acre:
$1,066 = 85% coverage level x 220 TA-APH yields x $5.70 projected price
The cash guarantee uses the cash price of $5.40 rather than the $5.70 projected price. The cash revenue guarantee then is $1,010 per acre (see Figure 2):
$1,010 = 85% coverage level x 220 TA-APH yield x $5.40 estimated cash price
Given an RP-85% purchase, farmers should receive close to $1,010 per acre through some combination of crop insurance payments and crop revenue. However, farmers could receive lower revenue if 1) basis is larger than the $.30 estimate, resulting in lower prices, or 2) farmers hold grain at harvest unpriced, thereby speculating on price movements, and then receive a lower price sometime after harvest.
A $1,010 revenue results in a $50 loss given $1,060 total costs (see Figure 2). Cash rents would have to be at $255 per acre for the farmer to break-even, considerably below the average cash rent used in our 2022 budgets.
Cash revenue guarantees and net returns go down with lower coverage levels (see Figure 2). For example, an 80% coverage level has a $950 cash revenue guarantee, $60 below the 85% level of $1,010 per acre. Net returns also decrease by $60 to -$110 per acre, with the break-even cash rent at $195 per acre.
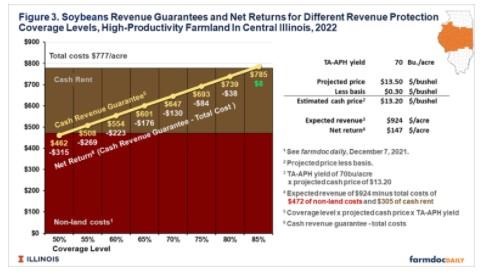
Figure 3 shows an example for soybeans. Relative to corn, soybeans have higher expected net returns: $147 per acre for soybeans versus $128 per acre for corn (see Figure 2). Changes in futures prices during the month of February may change that relationship. At an 85% coverage level, the cash revenue guarantee is $785 per acre, and net returns would be $8 per acre. Soybeans’ expected net return of $8 per acre is higher than corn’s expected net return of -$50 per acre, indicating there is less downside risk for soybeans, given that an 85% coverage level is used for both crops.
Suggestions
While there is a reasonable chance of good profitability in 2021, downside risk exists in corn and soybean production. Cash rents at average levels result in losses even at the highest RP coverage level. Farms with higher cash rent levels will face higher risks than those depicted in Figures 2 and 3.
Moreover, note that there will not be commodity title payments to offset losses at these price levels. Prices that result in crop insurance payments are positioned to be well above levels that trigger PLC payments. Moreover, ARC-CO payments are triggered at a much lower revenue level than crop insurance payments.
Based on these observations, risk management suggests are:
- Buy the underlying crop insurance policy at high coverage levels. Most Illinois farmers use Revenue Protection (RP) as their crop insurance product and purchase that product at high coverage levels (see farmdoc daily, January 25, 2022). Most farmers purchase at 80% and 85% coverage levels in northern and central Illinois. Southern Illinois farmers used 75% and 80% coverage levels. Use of RP at high coverage levels continues to be a good risk management practice for 2022.
- Consider using supplemental policies such as the Supplemental Coverage Option (SCO) or Enhanced Coverage Option (ECO), or a private policy offered by crop insurance companies. These products can further reduce risk, although not as well as RP decreases risks. SCO and ECO are based on county yields, which leaves the risk that the county has a good yield while the farm does not. Private products often have limits to their coverage. Furthermore, the premiums of the supplemental policies should be compared to expected net returns given that yields and prices are near projected levels. Often, premiums on supplemental policies will significantly reduce expected profits.
- Price more grain than usual. According to a 2018 survey, Illinois farmers usually have 10% of their expected corn production priced by January 1 and 22% by April 1 (see farmdoc daily, May 15, 2018). Having a higher percentage of grain priced this year may be warranted, particularly since current prices result in profitable production. However, there are still chances of increasing prices, particularly if yield shortfalls occur. As a result, pricing all of the expected production should not be done. Increasing use of pre-harvest hedging as a percent of expected production by 10 percentage points may be warranted.
In recent years, we have entered unusual times, at least compared to income scenarios from 2014 through 2019. While profitable opportunities exist, risks remain.
Source : illinois.edu