By Scott Irwin
Department of Agricultural and Consumer Economics
University of Illinois
The U.S. ethanol industry entered 2021 with a hangover from the COVID pandemic. While the industry managed to eke out a very small net profit during 2020, losses began to reoccur in late 2020. There was not much optimism about the profit outlook heading into 2021 with all of the uncertainty about COVID variants and the continuing economic impacts of policies to fight the spread of the virus. The purpose of this article is to estimate the profitability of U.S. ethanol production for the 2021 calendar year and assess the drivers of production profits during the year.
Ethanol Plant Model
A model of a representative Iowa ethanol plant is used to track the profitability of ethanol production. It is the same basic model of a representative ethanol plant that has been used in earlier farmdoc daily articles on the subject (e.g., February 13, 2019; January 29, 2020; January 27, 2021). The original version of the model was developed by Don Hofstrand of Iowa State University and was meant to be representative of a typical ethanol plant constructed in the mid-2000s. There is certainly substantial variation in capacity and production efficiency across the industry and this should be kept in mind when viewing profit estimates based on the model.
Some of the original assumptions of the model have been changed based on additional analysis or changing data availability. Current model assumptions include:
- Dry mill plant constructed in 2007
- 100 million gallon annual ethanol production capacity
- Plant construction costs of $2.11 per gallon of ethanol production capacity
- 40% debt and 60% equity financing
- 8.25% interest on 10-year loan for debt financing, with the loan fully repaid in 2017
- A total of $0.21 fixed costs per gallon of ethanol produced through 2017 and $0.15 per gallon in 2018-2021 (the decline is due to the loan payoff)
- Non-corn, non-natural gas variable costs (including denaturant) of $0.21-$0.26 per gallon in 2007-2011
- Non-corn, non-natural gas variable costs excluding denaturant of $0.16 -$0.20 per gallon after 2011
- Variable denaturant costs after 2011 computed as 2 percent of wholesale CBOB price
- 82.5 cubic feet of natural gas per bushel of corn processed
- Netback (marketing) costs of $0.05 per gallon of ethanol and $4 per ton of DDGS
- Extraction and marketing costs of $0.05 per pound of corn oil
Operating efficiency assumptions represent a key component of the model. These have been revised substantially over time as new data has become available. The latest assumptions are based on analysis of the operating efficiency of the U.S. ethanol industry in a recent farmdoc daily article (February 2, 2022). Specifically, the current assumptions for conversion rates are as follows:
- 2.75 gallons of ethanol (including denaturant) produced per bushel of corn processed over 2007-2011; 2.80 gallons of ethanol per bushel of corn over 2012-2014; 2.85 gallons of ethanol per bushel of corn over 2015-2018; and 2.90 gallons of ethanol per bushel of corn over 2019-2021
- 17.75 pounds of DDGS produced per bushel of corn processed over 2007-2011; 17.00 pounds of DDGS per bushel of corn for 2012-2016; 16.50 pounds of DDGS per bushel of corn over 2017-2018; 16.00 pounds of DDGS per bushel of corn in 2019; and 15.75 pounds of DDGS per bushel in 2020-2021
- 0.55 pounds of corn oil per bushel of corn processed over 2012-2014 (start extracting January 2012); 0.60 pounds of corn oil per bushel of corn processed in 2015; 0.70 pounds of corn oil per bushel of corn processed in 2016; 0.75 pounds of corn oil per bushel of corn processed in 2017-2019; 0.80 pounds of corn oil per bushel of corn processed in 2020; and 0.85 pounds of corn oil per bushel of corn processed in 2021.
To track plant profitability over time, weekly corn, ethanol, and DDGS prices at Iowa ethanol plants are collected starting in late January 2007. Crude corn oil prices for the Midwest are available from OPIS. Natural gas costs over 2007 through March 2014 are based on monthly industrial prices for Iowa available from the EIA. Due to a change in the behavior of the industrial price series, starting in April 2014 natural gas costs are based on monthly electric power consumer prices for Iowa, also from the EIA.
Analysis
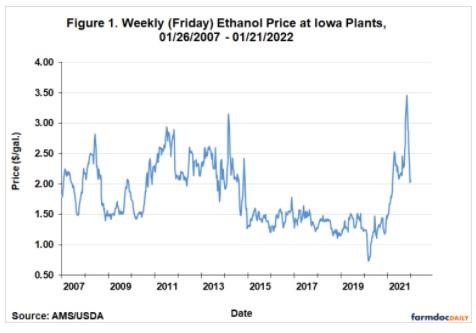
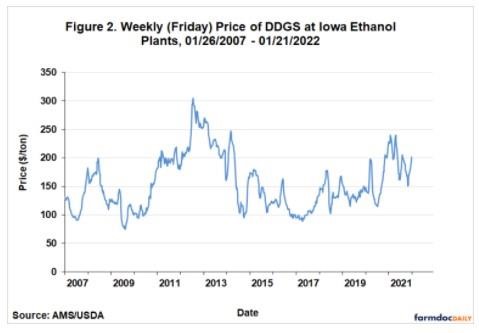
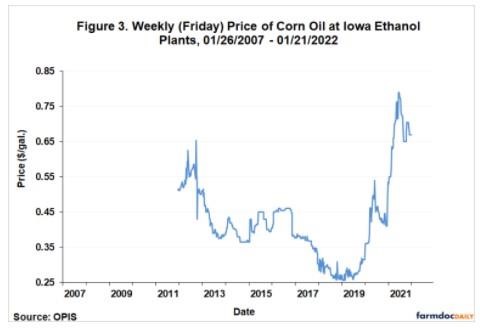
Figures 1, 2, and 3 present the three components of ethanol production revenue on a weekly basis from January 26, 2007 through January 21, 2022. Figure 1 shows the price of ethanol at Iowa plants. The figure reveals that prices in early 2021 started at relatively low levels below $1.50 per gallon. While this was much higher than the extremely low level at the peak of the COVID pandemic, prices were still stuck in the same sub-$1.50 range that had existed since 2015. Then in February 2021 ethanol prices began a meteoric rise that did not stop until they reached an all-time high (since 2007) of $3.46 per gallon in late November. From the beginning of the year to this peak, ethanol prices increased almost 150 percent. The price of ethanol did decline rather sharply into late 2021, dropping around $1 per gallon. In comparison, Figure 2 shows that DDGS prices actually declined throughout most of 2021. Figure 3 reveals that corn oil prices were almost as explosive as ethanol prices in 2021. Corn oil prices increased from a low of $0.41 per pound in early January to a peak of $0.79 in July, or an increase of more than 90 percent.
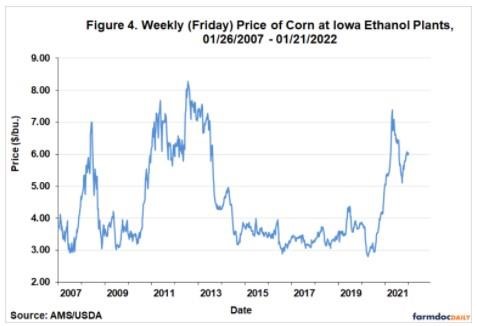
While prices for two of the three revenue components of ethanol production exploded in 2021, Figure 4 shows that the price of corn, the main cost component (about 80 percent), also rose substantially. The price of corn at Iowa plants started 2021 around $4.50 per bushel and then ascended rapidly to over $7 per bushel in May. Corn prices did drop in the second half of the year below $6 per bushel.
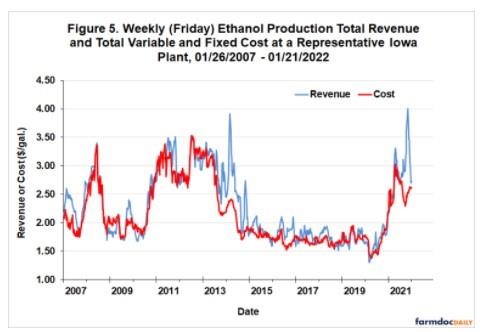
The picture that emerges is rapidly rising revenue and costs for ethanol producers in 2021. Figure 5 presents combined total revenue for ethanol, DDGS, and corn oil and total variable and fixed costs for the representative Iowa plant. Note that revenue reached a new high since 2007 of $4 per gallon in November 2021, while cost reached an historically high level of $3 per gallon in April 2021. Basically, increases in ethanol and corn oil prices in the first half of 2021 were matched by increases in the price of corn, leaving revenue and costs at about the same level. However, when corn prices decline after May, the gap between revenue and costs ballooned. The gap narrowed substantially late in 2021 as the price of ethanol declined (see Figure 1).
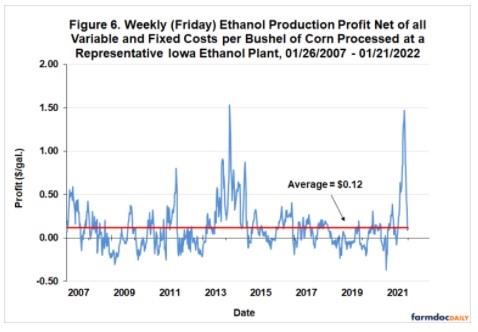
Weekly ethanol production profits net of all variable and fixed costs are shown in Figure 6. This is simply the difference between revenue and cost presented in Figure 5. Net profits oscillated substantially in the first half of 2021, depending on whether the increase in ethanol and corn oil prices outpaced the rise in corn prices. Net losses reached $0.37 per gallon in early February 2021, rebounded to $0.39 in late May, and then slumped back to a small loss in July. The fireworks really started after that, with net profits reaching just under $1.50 per gallon in late November 2021. This was the second highest level since 2007. Notice that net profits plunged rapidly late in 2021 back towards the long-term average of $0.12 per gallon. The average net profit for the entire calendar year in 2021 was $0.34 per gallon, almost three times the historical average.
A natural follow-up question is why did ethanol production profits spike to such exceptionally high levels in 2021? The answer is two-fold. The first part was already mentioned above. That is, corn prices declined after May reducing cost pressures for ethanol producers. The decline in corn prices was due to a variety of factors, including prospects of trend yields or above for the 2021 U.S. crop once planting was completed. The second part of the answer begins with Figure 7, which shows implied usage of gasoline in the U.S. by week for 2019-2022 (to date) calendar years. The key is the pattern of recovery from the collapse in gasoline use due to the COVID pandemic and related restrictions. The collapse began in March 2020, with a rapid recovery into the summer of 2020. However, gasoline use from that point on was slow to recover back to the pre-pandemic levels of 2019. This finally happened in July 2021 and continued throughout the second half of 2021.
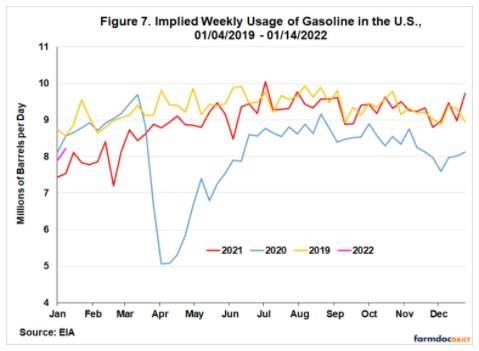
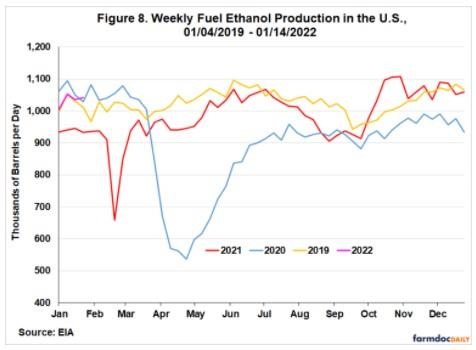
Figure 8 shows a similar chart for weekly ethanol production. The pattern of weekly ethanol production through the COVID pandemic is similar to that of gasoline usage, which makes sense given the close ties between gasoline consumption and ethanol production in the form of E10 gasoline blends. Notice that ethanol production recovered in the first half of 2021 in a similar manner as gasoline use. However, ethanol production fell rather precipitously relative to 2019 starting in late July and continued at depressed levels through September. It is not clear why ethanol production during this period fell off so much relative to 2019 pre-pandemic levels. The dip in ethanol production occurred at the same time as gasoline use continued to track the pre-pandemic levels of 2019. This created an explosive situation for ethanol prices and production profits. The situation was reversed relatively quickly beginning in October, and this surge in production eventually rebalanced supply and demand. But even this took several weeks to work through the system and ethanol prices did not begin to falter until December.
It is also useful to consider ethanol production profitability aggregated over an annual horizon for 2007-2021, as shown in Figure 9. Profits are presented in terms of both total pre-tax net returns and percent return to equity. The net profit of $33.9 million in 2021 was the second highest in the records available here, and by a wide margin. It was also the eighth profitable year in the last nine. With the addition of 2021 profits, the total cumulative (pre-tax) return to equity holders for the 2007-2021 period stands at $182 million, $55.4 million more than the assumed original equity investment for the plant of $126.6 million. We can use the average net profit for the representative plant to make a rough estimate of profit for the operating segment of the U.S. ethanol industry in 2021. Assuming all operating plants in the industry earned the average net profit for the representative plant of $0.34 per gallon and that total ethanol production for the U.S. was 15 billion gallons in 2021, total (pre-tax) profit for all operating ethanol plants can be estimated at $5.1 billion. By any standard, it was a tremendous year for ethanol producers.
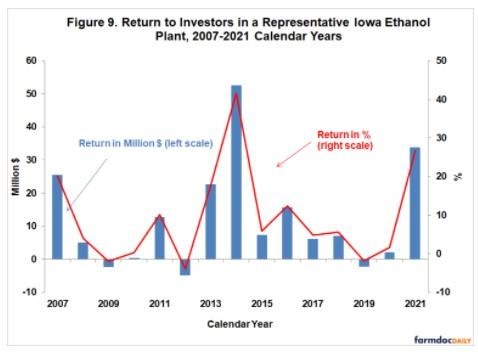
Lastly, the percent return to equity holders provides useful information on the attractiveness of investment in ethanol plants relative to other investments. The average return was 9.6 percent over 2007-2021 and the standard deviation, a measure of risk, was 12.6 percent. By comparison, the average return for the stock market over this period, as measured by the S&P 500, was 12.1 percent and the associated standard deviation was 17.5 percent. The ratio of average return to standard deviation provides one measuring stick of an investment’s return-risk attractiveness, and on this measure the ratio for ethanol investment, 0.77, is higher than the ratio for the stock market as a whole, 0.69. From this standpoint, ethanol plants have a respectable record of investment performance over the last 15 years.
Implications
After a bit of a rough start, 2021 turned out to be a banner year for ethanol producers. Powered by explosive ethanol and corn oil prices, production revenue reached a new high (since 2007) during November 2021 of $4 per gallon. The average net profit for the entire calendar year in 2021 was $0.34 per gallon, almost three times the historical average. This was the second highest average profit of the last 15 years. Assuming total ethanol production for the U.S. was 15 billion gallons in 2021, total (pre-tax) profit for all operating ethanol plants is estimated to be $5.1 billion. An important driver of the historically high net profits was a dip ethanol production relative to pre-pandemic levels of 2019 during the second half of 2021. Gasoline usage during the same time period continued to track pre-pandemic levels and this created explosive pressure on ethanol prices and net profits. The situation was reversed relatively quickly beginning in October, and this surge in production eventually rebalanced supply and demand. An interesting and unresolved question is why ethanol production lagged gasoline usage as much as it did during the second half of 2021.
Source : illinois.edu