By Jonathan Coppess
It may have been one of the stranger twists inside the farm bill reauthorization effort, but over the summer a minor contretemps arose over the Congressional Budget Office projections for proposed changes to policy, known as a score (Downs and Hill, July 31, 2023; Wiesemeyer, July 24, 2023; Downs and Hill, July 24, 2023; Brasher, Wicks, Tomson, and Davies, July 21, 2023). Challenges from CBO scoring are nothing new to a farm bill debate, but the mid-summer’s flare-up could be telling. For one reason, the CBO Director decided it was necessary to respond directly. In doing so, he disclosed that as of July 20, 2023, CBO analysts had “already provided more than 1,000 estimates” or scores on proposals (Swagel, CBO, July 20, 2023). What at first might seem simply a passing oddity of the insider’s game, may well be more telling in context and fuller perspective. This article gleans some perspective from 1,000 CBO scores for a farm bill debate.
Background
Under Congressional budget rules, CBO calculates a baseline using 10-year projections for outlays with those projections based an assumption that Congress does not revise the statute during those ten years (7 U.S.C. §907). CBO projects changes in spending as against the baseline, so legislative text to revise programs would be projected against the baseline for changes in outlays, which is what is known as the CBO score (7 U.S.C. §639). A substantial challenge for this mode of operation is that legislative decisions are impacted, if not nearly controlled by, projections 10 years into an unknown future as are the costs of any changes.
Table 1 presents the CBO baseline for the major farm payment programs by program crop as reported in May 2023 (CBO, May 2023). In total, CBO projects more than $65.5 billion in payments for fiscal years (FY) 2024 to 2033, almost 75% ($48.7 billion) of that total is for six crops: corn, soybeans, wheat, cotton, rice, and peanuts. The discussion below will focus on these six crops.
Arguably more critical, Table 1 also presents a significant problem in this baseline: 60% of the total spending in the baseline is spent in what are known as the “outyears” or the years after the farm bill expires. If a farm bill is authorized in 2023 it would expire in 2028 and the outyears are FY 2029 to 2033, representing $39 billion of the $65.5 billion baseline. This is a particular problem for crops like corn in which the outyear costs ($15 billion) are more than the entire ten-year baseline for cotton, rice, and peanuts ($12 billion) combined. In addition, 63% of soybean spending and 64% of wheat spending are in the outyears. Depending on the design of any changes to policies, like the reference prices used in PLC, the costs of those changes are scored for 10 years and a majority of that spending would be after the farm bill authorization would expire.
Discussion
The outyear spending challenge illustrated in Table 1 is the direct result of the policy design for ARC and PLC; specifically, the mechanisms for triggering payments and the methods by which CBO projects the costs of the mechanisms. Most importantly, the same dynamics in the baseline will translate to any CBO score of a proposal to revise ARC and PLC. In other words, increasing statutory reference prices (SRP) will incorporate these matters, with most of the cost of doing so coming after the farm bill expires. At the same time, the timing shifts delay any benefit to the farmers. There are three policy designs that cause this: (1) the effective reference price (ERP) calculation or escalator for corn, soybeans, and wheat; (2) use of the marketing year average (MYA) price; and (3) the statute requires payments after October 1, the subsequent fiscal year.
(1) The Effective Reference Price
As discussed previously, the 2018 Farm Bill added an effective reference price (ERP) to the PLC program, which is also incorporated as a floor in the ARC program calculations (farmdoc daily, August 10, 2023). The ERP is calculated as the higher of the statutory reference price (SRP) or 85% of the five-year Olympic moving average of MYA prices (up to 115% of the statutory reference price). PLC payments are triggered in those marketing years in which the MYA is below the ERP (if it is higher than the SRP). Importantly, the ERP incorporates the MYA prices from the five years prior to the program year. When there are MYA prices high enough to trigger the ERP, those are carried forward into future program years and increase projected outlays. Among the six major crops, this only matters for corn, soybeans, and wheat because the statutory reference prices for seed cotton, rice, and peanuts are high enough relative to each crop’s MYA as to generally not trigger the ERP.
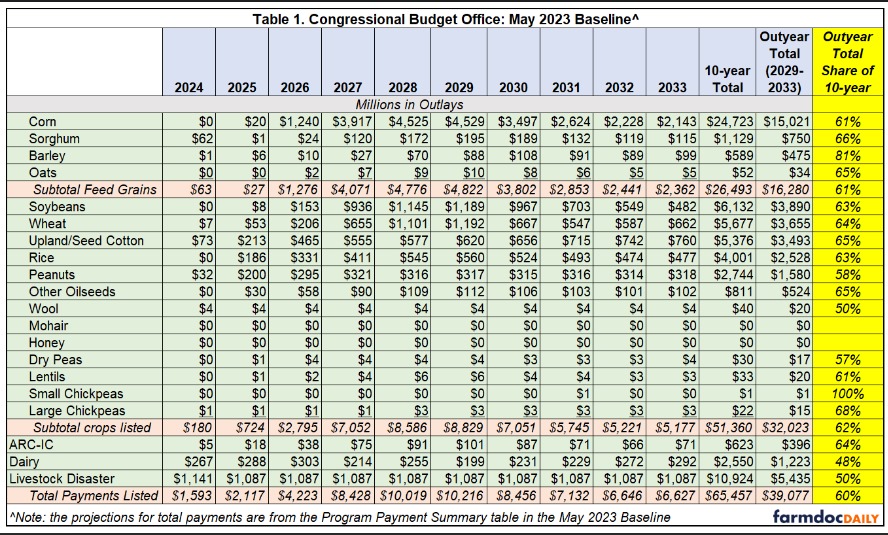
Corn provides arguably the best example for the ERP; because it is the largest crop in the program (94 million base acres), the policy design issues discussed above are magnified over a ten-year window. Figure 1 illustrates the MYA price, SRP, and ERP for corn, as well as the projected PLC outlays from the May 2023 CBO baseline. Importantly, Figure 1 aligns the marketing year and fiscal years to address the timing shift discussed below. In Figure 1, the high MYA in 2022 and 2023 (and earlier) marketing years trigger the ERP beginning with MY2024 and FY2025. The higher ERP continues through MY2026 even as MYA drops, triggering large payments through FY2028. The outyears are particularly notable: the ERP drops below the MYA, but outlays continue to be projected through FY2033. In those years, the ERP remains close enough to the MYA (ERP at nearly 95% of MYA) to trigger projected payments.
An important note about the ERP: if Congress simply extended the current Title I program provisions, the reference prices for corn, soybeans and wheat would increase through the ERP. Thus, the trigger prices for corn would increase at least through the 2024-2028 marketing years. For soybeans, they would increase for most of the baseline, the 2024-2031 marketing years. For wheat, the increase is the shortest and is projected for the 2025-2028 marketing years.
(2) Timing Shifts Backload Payments in the Outyears
The second and third of these mechanisms create timing shifts in the programs. First, the marketing year average (MYA) prices are calculated as an average of the prices received by farmers over the 12-month marketing year. Note that each crop’s marketing year begins in the month of harvest and completes twelve months later; for corn and soybeans, the 2023 marketing year began on September 1, 2023 (USDA-ERS, Documentation; USDA-FAS, Commodity Marketing Years). Second, payments are made in October after the marketing year, which results in payments in the second fiscal year after the crop year. For corn and soybeans, this means the following: the 2023 crop year ends with harvest this fall; the marketing year began on September 1 and will conclude at the end of August 2024; any payments will be made in October 2024, which is FY 2025. This contributes to the outyear problem discussed above because any payments incurred in the last crop year of authorization (2028) will be made in FY2030. In the CBO baseline and Table 1, the price projections for last year (2022) impact the outlays in the first year of the baseline, FY2024. In other words, the farmer receives a payment a year after the crop is harvested and CBO projects it two fiscal years after it is harvested.
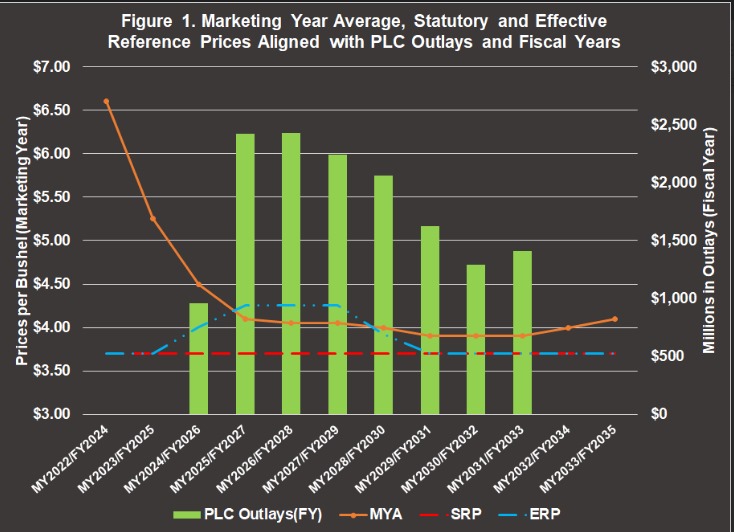
Figure 2 illustrates this relationship for corn, soybeans, and wheat—the only three of the six major program crops for which the ERP is effective in the baseline. Figure 2 calculates the ERP as a percent of the MYA from the projections in the May 2023 CBO baseline. Those marketing years in which the ERP is 100% or more of the MYA would be expected to trigger payments in the second fiscal year following the marketing year. Figure 2 also helps explain why projected payments in the first year of the CBO baseline (FY2024) are minimal: MYA prices were high relative to ERP in marketing year 2022. In fact, CBO projects only $180 million in outlays for FY2024 for ARC-CO and PLC, $105 million of it for seed cotton ($73 million) and peanuts ($32 million), the crops with SRP high relative to MYA and for which the ERP does not trigger.
The timing shifts combined with the ERP in the ARC and PLC policy designs cause most of the costs to be projected in the years after 2028, when a farm bill reauthorized in 2023 would expire. Figure 2 illustrates this for corn, soybeans, and wheat. It also demonstrates how the costs of the program increase with increases in the trigger price (ERP). For example, the marketing year ERP for corn is projected to be $4.01 per bushel, which is 8% higher than the SRP ($3.70); with that increase, CBO projects nearly $1 billion in PLC outlays for FY2026. This level of cost is notable because the projected MYA for 2024 is $4.50 per bushel and an ERP/MYA relationship of 89%. In other words, if the CBO projections for MYA and ERP are correct, farmers with corn base would not receive payments for the 2024 crop but CBO projects outlays for it in FY2026. This is a reminder that the ERP and MYA only need to be close enough for CBO to project payments and costs.
(3) Impasse, Costs & Consequences: A Thought Experiment
Given that conservation program spending is generally capped by acres or amounts, and the authorizations were extended through FY2031 by the Inflation Reduction Act of 2022, there are unlikely to be many scoring requests for that title. Over 80% of the costs of the crop insurance program are in premium subsidy projections and there has been little public discussion that either committee is considering changes to crop insurance premium subsidy, so it is unlikely that there are many scoring requests for it. Of the farm policy titles, that leaves only Title I as the likeliest reason for CBO producing more than 1,000 scores; since the main request appears to be increasing the statutory reference prices, it is likely that a majority of those 1,000 CBO scores have involved variations on current reference prices. This is an incredible amount of work for a single policy design and a reminder of the complexities and challenges in reauthorization.
From the preceding discussion, an across-the-board increase in reference prices would likely come with a large CBO score and most of the cost would be in the outyears, after 2028. What might a score look like? Only CBO can answer that question and there are currently no public scores available for increasing reference prices, but the dynamics discussed above provide important clues. What do we know? First, any increase in the SRP will also increase the ERP for corn, soybeans, and wheat. Second, CBO will project payments even where the MYA is below the ERP if it the two are close enough. This is likely due to the probability that actual prices will be lower than the projected MYA in any given year. Second, the outlay projections will increase as the ERP/MYA percentage approaches 100% and obviously increase even further above it. Third, that relationship is not linear; outlays may grow at a larger rate in some years and less in some years depending on changes in the ERP/MYA price relationship. Finally, and most importantly for farm bill cost estimates, the MYA projections for any score do not change from those in the baseline, so any change in the SRP impacts that relationship.
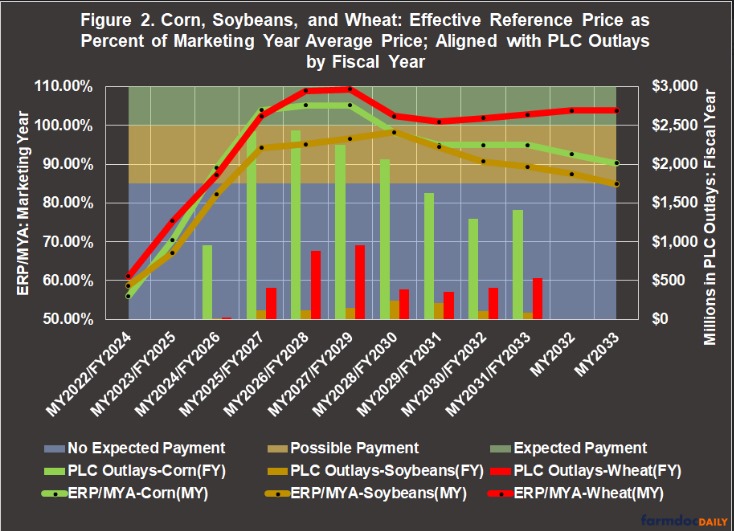
The patterns in Figures 1 and 2 form the basis for attempting a thought experiment to craft back-of-the-envelope cost estimates for the statutory reference prices. In Figure 2, PLC outlays trigger for an ERP/MYA relationship at approximately 85% (slightly less for soybeans) and increase quickly as the relationship exceeds 100%. For a thought experiment intended to provide perspective on the implications or consequences of this, consider what a 10% across-the-board SRP increase would look like. This is not based on any actual legislative text or proposal before Congress and is merely for the purposes of illustration. Figure 3 illustrates the ERP/MYA relationship for the six major commodities if the SRP is increased by 10% over the 2018 levels.
Note that a 10% SRP increase would be unlikely to trigger payments for the 2023 marketing year (2025 fiscal year) for corn (77.5%), soybeans (74%), or wheat (83%). PLC outlays (and payments) are much more likely for rice base, and certain for seed cotton (103.5%) and peanut (119%) base with this increase in SRP. Given what CBO projects currently, a 10% increase in the SRP would likely be extremely expensive over a 10-year cost projection: corn outlays were nearly $1 billion when the ERP/MYA relationship was 89% and jumps to $2.4 billion when that relationship approached 104%; with a 10% SRP increase, the ERP/MYA relationship for corn is nearly 100% in 2024 (FY2026) and almost 110% in 2025 (FY2027). It remains above 100% until marketing year 2033, which is outside the budget window. Using the 85% ERP/MYA relationship, it is possible to derive a back-of-the-envelope cost estimate for a 10% increase in the SRP. An initial calculation produced a total cost range from nearly $16 billion to over $28 billion (FY2024 to 2033) for the six major commodities. The estimates need further work and refinement but provide context and a place to start. Note also those costs would be expected to score higher if all other program crops are included. To reiterate, this preliminary estimate is not a CBO score, nor is it based on any actual CBO scores.
Concluding Thoughts
From a distance, the entire matter of CBO cost projections and the fact that 1,000 scores were produced by late July may seem like little more than a tempest in a shot glass. While these are all projections into an unknown future and will be wrong, they are critically important to reauthorizing a farm bill. The CBO cost estimates will determine policy designs and political success (see e.g., Hill, August 9, 2023). There are also real-world implications or consequences that should also be considered.
First, even a 10% increase in the statutory reference prices for all crops would come with almost no payoff in the near-term for most farmers (except those with seed cotton, rice, or peanut base acres), but could cost tens of billions in CBO projections that will have to be offset by cutting other programs; because MYA prices into the future are unknown, it amounts to an exceptionally large gamble. A desperate search for offsets and gimmicks on the score is also currently at least contributing to an impasse on reauthorization of the farm bill (see e.g., Hart, September 8, 2023).
In short, there are not simple available pots of spending that can be easily reduced to cover even the low end of the above estimate. The real risk of the scramble for offsets and workable scores, in fact, are to the historic investments in conservation programs and climate change efforts made by the Inflation Reduction Act of 2022. Note that based on CBO outlay projections, it is unlikely that cutting the entire investment would cover all of the costs and maybe less than half, with most of those costs booked in the outyears. Cutting those funds could have real consequences for farmers and those consequences would be felt immediately. Consider that the Congressional Research Service (CRS) reported earlier that NRCS funded 56% of eligible program applications for EQIP in FY 2022, which had improved on 54% in FY2021 and 44% in FY2020 (USDA-OBPA, 2024 Explanatory Notes; CRS: March 20, 2023).
It is not a great leap of imagination to realize that cutting Inflation Reduction Act funding to gamble on increasing statutory reference prices could be a horrible bet and especially for any farmer who is stuck in a conservation program backlog. Doing so quite literally takes money away from farmers who are seeking to use the funds to invest in conserving natural resources like soil and water, as well as helping address climate change, and gambles it on unknown payments into the future. Increasing reference prices helps most those farmers with seed cotton, rice, and peanut base. Worse still, if the outyear problem holds for the score (and it will) more than 60% of any funds cut would effectively be wasted to cover the costs in years after the farm bill expires. The bad gamble becomes something much worse and provides yet another reason to hit pause on this push for higher statutory reference prices. To conclude, this discussion is acknowledged to be only a preliminary analysis and much work remains to be done. The discussion provides an initial look and perspective on the challenges—curiosity sparked by the news of 1,000 CBO cost projections. Further analysis will be forthcoming to seek a better understanding of the consequences, implications, and risks.
Source : illinois.edu