By Maria Kalaitzandonakes and Jonathan Coppess
The cost of food has increased dramatically in the wake of the Covid-19 pandemic and the Russia-Ukraine war (see e.g., USDA, July 25, 2022; BLS, August 10, 2022; Fowers, July 26, 2022); Smialek and Erdos, July 27, 2022). As a part of the second quarter of the Gardner Food and Agricultural Policy Survey (farmdoc daily, August 18, 2022), we surveyed US consumers about their experiences with inflation. This article reviews the results, examining what coping mechanisms consumers are using and how food type and form are changing in response to rising food prices.
Background
News reports have indicated that US consumers are engaging in food-related coping strategies to manage the impact of rising prices, for example, switching from their typical supermarket to a discount grocer, purchasing less expensive food types, and planting a garden (e.g., Bernard, June 28, 2022; Shaban, August 10, 2022). Additionally, results from the July Consumer Food Insights Report (2022) show that food spending continues to rise and more consumers are looking for sales and switching to generic products. These coping strategies, and related changes in consumer demand, have important implications for stakeholders along the food supply chain.
Previous research has shown how consumers cope with rising food prices in other contexts. For example, an investigation of coping strategies in South Africa found that the majority of participants engaged in coping strategies including buying in bulk, switching to cheaper brands, sending children to neighbors or relatives for meals, reducing portion sizes, and growing a garden (Mkhawani, et. al., 2016). Similarly, an investigation of coping strategies in Pakistan found that consumers looked for sales on food items, gleaned fields for leftover grain, purchased government subsidized foods, and reduced purchasing of other items (e.g., clothing) (Gazdar and Mallah, 2013). Here, we evaluate how US consumers coped with rising food prices in the last 12 months.
Methods and Survey Design
The second quarter of the Gardner Food and Agricultural Policy Survey (farmdoc daily, August 18, 2022) was conducted using Qualtrics Panels in August 2022. We surveyed approximately 1,000 participants, and, as before, respondents were recruited to match the US population in terms of gender, age, income, and geographic region.
We first asked participants to rate the extent they felt inflation had affected them in the last 12 months from 0 (not affected) to 10 (highly affected). We then asked participants several questions about their experiences with rising food prices in the last 12 months. For these questions, participants were asked to only consider how rising food prices had changed their choices, and to not include other things that might have altered their recent purchasing (e.g., a new diet). We asked participants about what coping strategies they used and how the types and forms of foods they purchased changed. Coping strategies we investigated included: beginning to buy in bulk, changing to cheaper brands, using a food bank, etc. We also asked participants about how the types of foods they purchased (e.g., red meat, eggs, grains) changed due to rising food prices. Participants answered on a 5-point scale from much less to much more. Participants were also able to indicate they never purchased the item using an “N/A” option. We also examined how the form of products changed due to inflation. Specifically, we asked participants about whether rising food prices had changed their purchasing of fresh, frozen, canned, and dried/packaged food. Like the types of food, we measured this on a 5-point scale from much less to much more. Finally, we asked participants questions about their demographics and to answer the USDA 6-item food security survey module.
Survey Results
Impact of inflation
We first asked participants to rate the extent to which they felt inflation had affected them in the last 12 months on a scale from 0 (not affected) to 10 (highly affected). On average, we find consumers reported 7.0. This was quite consistent across income groups (see Table 1). On average, consumers in all income groups below $200,000 in annual household income rated the impact of inflation between 6.8 and 7.2. Only consumers with incomes of $200,000 or more had a slightly lower rating (6.1).
| Table 1. Mean Inflation Impact (0=Not Affected to 10=Highly Affected) Across Income Groups |
| Income Group | Mean Inflation Impact |
| Less than $25,000 | 7.2 |
| $25,000-$49,999 | 7.1 |
| $50,000-$74,999 | 6.9 |
| $75,000-$99,999 | 7.0 |
| $100,000-$149,999 | 6.8 |
| $150,000-$199,999 | 7.1 |
| $200,000 or more | 6.1 |
We also find that consumers with higher levels of food insecurity reported being more highly impacted by inflation. Table 2 presents the average inflation impact by food security status. Those with high or marginal food security had an average rating of 6.1, those with low food security had an average rating of 7.1, and those with very low food security had an average rating of 8.5.
| Table 2. Mean Inflation Impact (0=Not Affected to 10=Highly Affected) Across Food Security Statusa |
| Food Security Status | Mean Inflation Impact |
| High or marginal food security | 6.1 |
| Low food security | 7.1 |
| Very low food security | 8.5 |
| aFor more on how USDA classifies food security status, see: https://www.ers.usda.gov/media/8282/short2012.pdf. |
Additionally, we find that consumers in larger cities and in rural areas reported somewhat higher impacts of inflation than those in suburbs near large cities or in small cities/towns. Table 3 shows the average inflation impacts across location.
| Table 3. Mean Inflation Impact (0=Not Affected to 10=Highly Affected) Across Location |
| Location | Mean Inflation Impact |
| A large city | 7.3 |
| A suburb near a large city | 6.8 |
| A small city or town | 6.7 |
| A rural area | 7.2 |
Coping Mechanisms
We also asked consumers about the coping mechanisms they engaged in response to rising food prices. On average, we find that US consumers engaged in an average of 3.6 coping mechanisms. Table 4 reports the proportion of US consumers that used each coping mechanism.
| Table 4. Proportion of US Consumers That Used Different Coping Mechanisms Due to Rising Food Prices |
| Coping Mechanism | % of Respondents |
| Started buying a cheaper brand/store brand | 42.7% |
| Started spending less money on non-food items | 40.7% |
| Reduced the amount I purchase from restaurants | 36.5% |
| Changed the types of foods I purchase | 33.0% |
Started going to multiple grocery stores to buy items where they are
cheapest | 29.7% |
| Started going to a cheaper grocery store | 26.8% |
| Started using a food budget | 25.8% |
| Started using coupons for food purchases | 25.6% |
Started cutting the size of meals or skipping meals because there wasn’t
enough money for food | 21.8% |
| Started buying in bulk | 19.4% |
| Started going to cheaper restaurants | 18.5% |
| Started growing my own food | 14.4% |
| Started using government food assistance (e.g., SNAP, WIC, etc.) | 13.4% |
| Started going to a food bank or food pantry | 10.1% |
| Other | 0.8% |
The most common coping mechanism was buying cheaper brands or store brands (42.7%). Spending less on non-food items (40.7%), reducing the amount purchased from restaurants (36.5%), and changing the types of food purchased (33.0%) were also more common coping strategies. Additionally, we find that more than a quarter of consumers began going to multiple grocery stores to purchase items where they were cheapest, switched to a cheaper grocery store, began using a food budget, and began using coupons for food purchases. Less common coping strategies included buying in bulk (19.4%), going to cheaper restaurants (18.5%), and growing their own food (14.4%).
Rising food prices also bring concerns of increased food insecurity. We find that 21.8% of US consumers indicated they had begun cutting the size of meals or skipping meals because there wasn’t enough money for food due to rising food prices in the last 12 months. In addition, we found that over 13.4% reported that they began using government food assistance and 10.1% reported that they began going to a food bank/food pantry due to rising food prices.
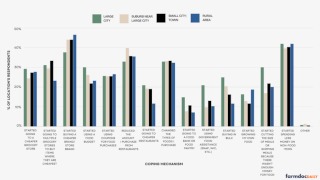
We also find that households engaged in coping mechanisms differently. For one, food insecure households used all coping mechanisms at higher rates than food secure households. For another, consumers living in different locations also reported having used different coping mechanisms. Figure 1 shows the proportion of consumers in large cities, suburbs near large cities, small cities/towns, and rural areas that reported using each coping mechanism. Some of these coping mechanisms may reflect differences in access across locations. For example, rural consumers were less likely to begin going to multiple stores and were more likely to start growing their own food and switch to cheaper brands or store brands. We also find that urban consumers were more likely to begin using a food bank/pantry, government assistance (e.g., SNAP, WIC), and cutting the size of meals or skipping meals. Some of these differences are likely also explained by the location of food insecure individuals. Additionally, participants were asked to indicate changes to their behavior due to rising food prices, however some coping mechanisms may have been more common in certain areas prior to rising food prices. For example, we see the largest increase in purchasing food in bulk from urban consumers. Purchasing in bulk is likely to have been more common prior to rising food prices in non-urban locations, where homes generally have more storage and live further from food shopping locations increasing the value of stocking up.
Figure 1. Proportion of US Consumers That Used Different Coping Mechanisms Due to Rising Food Prices by Location
Changes in Type and Form of Food Products
Beyond more general coping mechanisms, we also asked whether the types of food they purchase had changed due to rising food costs in the last 12 months. We asked about red meat, poultry, seafood, dairy products, eggs, fruits, vegetables, grains, and snacks/sweets. Figure 2 shows what proportion of consumers said their purchasing of each food type changed (increased, decreased, or remained the same) due to rising food prices.
Figure 2. Proportion of US Consumers That Changed Food Type Due to Rising Food Prices
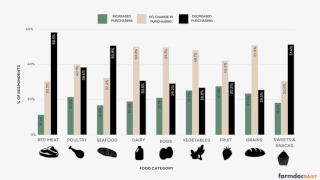
We find that the majority of US consumers indicated that they reduced their purchasing of red meat (58.3%) and seafood (50.8%) due to rising food prices. Additionally, 51.4% of consumers indicated they reduced the amount of sweets/snacks they purchased due to rising food prices. Some consumers (38.4%) also indicated they had reduced their purchasing of poultry due to rising food prices. For the other food categories, including dairy, fruits, vegetables, eggs, and grains, more consumers indicated their purchasing had not changed.
We also ask about the form in which they purchased food (fresh, frozen, canned, dried/packaged). Table 5 reports the proportion of US consumers that increased, decreased, and did not change their purchasing of each form of food. We find that many consumers did not change the forms of food they purchased. Many consumers said they continued to buy the same amount of food in fresh (45.3%), frozen (39.2%), canned (43.6%), and dried/packaged (47.2%) form. The lack of change in food form may be due to lack of granularity by food type, for example, consumers may have increased purchasing of frozen vegetables but decreased purchasing of frozen entrees.
| Table 5. Proportion of US Consumers That Changed Food Form Due to Rising Food Prices |
| | Food Form |
| Change in Purchases | Fresh | Frozen | Canned | Dried/Packaged |
| Purchased More | 23.2% | 30.6% | 29.7% | 24.9% |
| No Change in Purchasing | 45.3% | 39.2% | 43.6% | 47.2% |
| Purchased Less | 31.4% | 30.2% | 26.7% | 27.9% |
Concluding Thoughts
Results from the 2nd quarter panel of the Gardner Food and Agricultural Policy Survey show that food prices are having an impact on the way consumers shop and the foods consumers buy. US consumers reported engaging in an average of 3.6 coping mechanisms. The most utilized coping mechanisms were switching to cheaper brands or generics, reducing money on other things (including restaurants), and changing the food types they purchased. Coping mechanisms differed across locations, likely in part due to availability and location of food insecure Americans. Additionally, more than half of consumers indicated they had reduced their purchasing of red meat, seafood, and sweets/snacks, but few reported changes in the form of foods purchased. Finally, as expected, we find that rising food prices hit the least food secure Americans hardest. Rising food prices have important implications for the nation’s food security, and we find that over 20% of US consumers reported they had begun cutting the size of meals or skipping meals because there wasn’t enough money for food, due to rising food prices.
In digesting the data presented in this article, it is important to keep in mind that the survey is only a snapshot; while intended to be representative, we surveyed approximately 1,000 consumers in August 2022 about their experiences with inflation over the previous 12 months. Additionally, the survey responses are self-reported and based on people’s perceptions. These are imperfect measures as consumers may overestimate or underestimate their behaviors. However, consumers’ perceptions of the impact of inflation on their lives and their reported behavior changes provide important indicators about inflation and its impacts. Additional research is needed to understand how these changes played out in actual purchasing and consumption.
Few things impact all American consumers more directly than increased food costs. The adjustments consumers make to cope with rising prices have important implications for both food and agricultural stakeholders and for policymakers focused on food security and nutrition.
Source : illinois.edu