By Bradley Zwilling
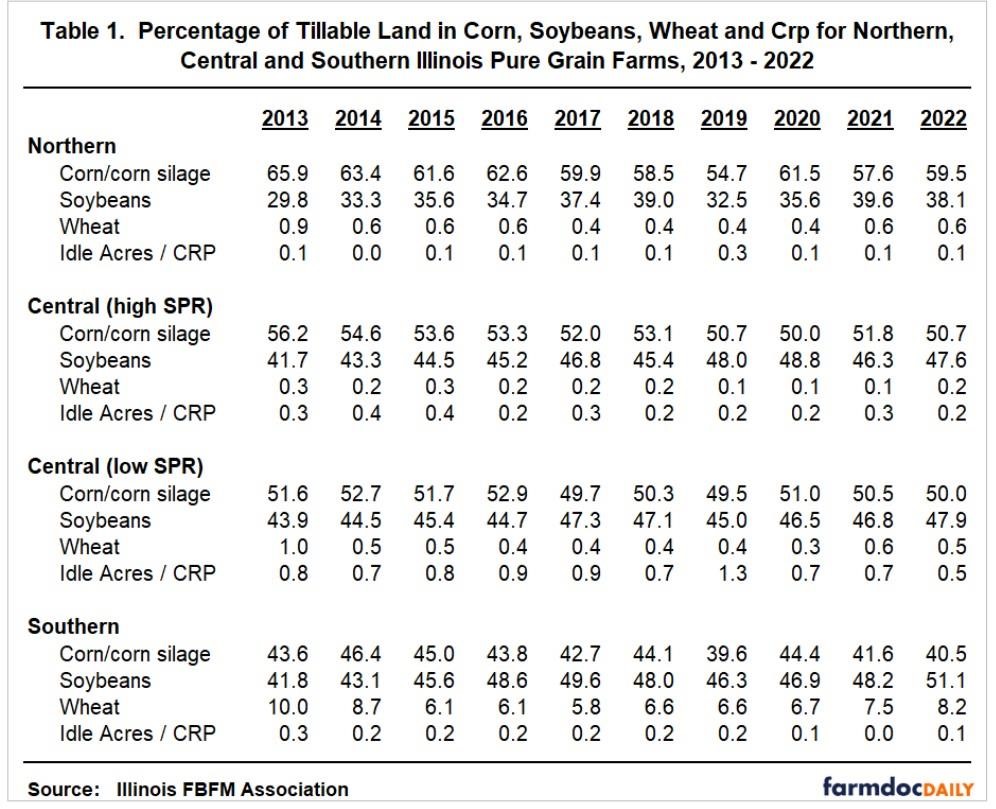
This article examines historic cropping patterns for northern, central and southern Illinois pure grain farms from 2013 through 2022 (Table 1) and the percentage of acres planted to corn by region from 1993 to 2022 (Figure 1). Farms in the study are enrolled in the Illinois Farm Business Farm Management (FBFM) Association. Farms in northern Illinois are generally located north of Interstate 80. Farms in southern Illinois are generally located south of Interstate 70. Central Illinois farms are located between the two Interstates. Farms in central Illinois are further divided between higher and lower soil productivity (SPR) levels. Financial, agronomic, weather, and economic factors along with the relative price of corn and soybeans will be taken into consideration by producers if and when adjustments are made in their cropping rotations.
Northern Illinois
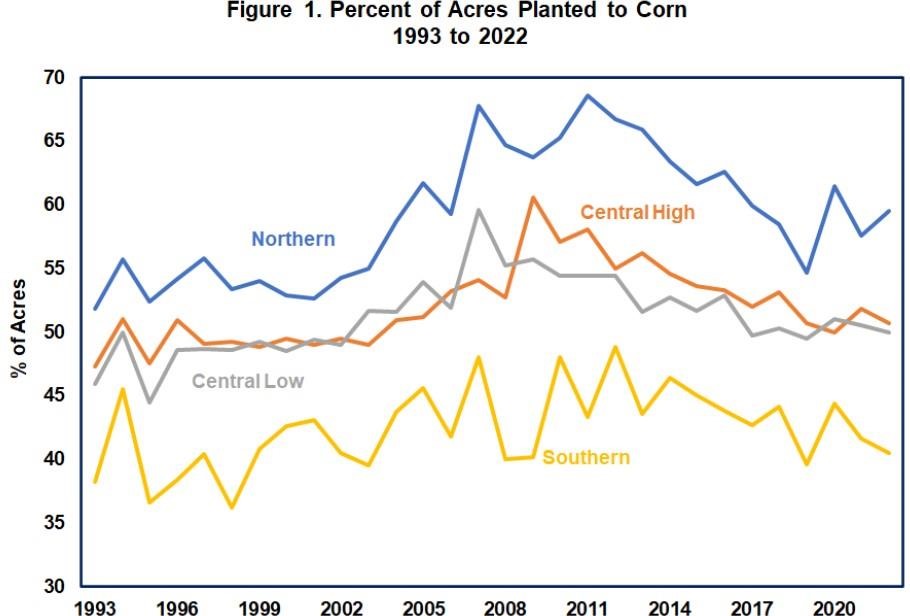
Northern Illinois farms historically have had the highest percentage of land in corn than any other area in the state. During the 2013 through 2022 time period, at least 54.7 percent of the tillable land in these farms each year has been in corn. The highest was 65.9 percent in 2013 and the lowest was 54.7 percent in 2019. These farms have been trending towards a corn/soybean rotation with soybean acres slowly increasing and corn acres decreasing. However, in 2020, the percentage of corn acreage began to increase and has held close to 60 percent since then. Less than 1 percent of the tillable land on these farms in any year has been planted to wheat. The percentage of tillable land in Conservation Reserve Program (CRP) or idle acres was highest in 2019 due to wet weather conditions leading to acres being left idle due to prevent planting claims. The thirty-year trend for tillable acres planted to corn increased until the 2007 to 2011 time frame and then it decreased until 2020 (Figure 1).
Central Illinois
During the last ten years, farms in central Illinois have shown a gradual decrease in the amount of corn acres in their crop rotation. These farms have been the closest to a 50/50 corn/soybean rotation as compared to the other areas in the state. Farms in central Illinois with the higher soil ratings have varied from 50.0 percent of their land in corn in 2020 to 56.2 percent in 2013. Soybean acreage has varied from 41.7 percent in 2013 to 48.8 percent in 2020. Like farms in northern Illinois, these farms had a decrease in corn acreages in 2020, but not to the same magnitude. These farms had less than one percent total in wheat and idle / CRP acres. In Figure 1, the percentage of corn acres was steady until about 2005; gradually increased to the highest percent of 60.6 in 2009; and then decreased back to around 50 percent.
Farms in central Illinois with the lower productivity soils were similar in terms of cropping patterns to those in central Illinois with the higher productivity soils. Generally, they planted between 49 and 53 percent of their land in corn and between 44 and 48 percent of their land in soybeans. Although these farms had slightly more wheat acreage than the other central Illinois farms, it still was insignificant. Like in Northern Illinois, there was an uptick in idle / CRP acres in 2019 due to the wet spring. The trend in Figure 1 is like central Illinois with the higher quality soils, however, the highest percentage of acres planted to corn was in 2007.
Southern Illinois
Crop rotations in southern Illinois have historically varied from central and northern Illinois primarily due to differences in soil types and climate. Soils in this region are subject to significant yield loss in dry weather conditions. Partly because of this factor, southern Illinois has tended to raise more wheat and more soybeans relative to corn. Wheat and soybeans tend to perform better in adverse weather conditions. Producers can also take advantage of double cropping soybeans after the wheat is harvested. Over the last ten years, there have been fluctuations from more wheat to less and then back to higher percentages of wheat in the last couple of years. The percentage of land planted to corn has varied from 39.6 percent in 2019 to 46.4 percent in 2014. Acreage planted to soybeans has ranged between 41.8 percent in 2013 to 51.1 percent in 2022. 2014 was the only year in the last ten that there was a larger percentage of corn acres than soybean acres. Acres planted to wheat have varied from 5.8 percent in 2017 to 10.0 percent in 2013. There is more fluctuation in cropping patterns in southern Illinois as compared to other regions of the state due to the effect of wet weather. Soils in this area of the state take a longer time to dry out and extended wet weather during planting can result in more year-to-year variances in cropping patterns. In Figure 1, the percentage of corn acres varies each year with no substantial trend either way, however, on average it is between 35 and 50 percent over the last 30 years.
Summary
Over the last ten years, when we look at the cost to produce corn versus soybeans, it has been more profitable economically to produce soybeans than corn, except for the last couple of years. That is why you have generally seen a downward trend in the percentage of corn acres in crop rotations in Illinois. Over the last 30 years, we have seen a shift to more corn acres until the 2007 to 2012 time period (when we saw the ethanol mandate come into play) and from there the percentage of acres in the crop rotation planted to corn has decreased until about 2020. More detailed enterprise records and analysis will help in making economic and financial decisions; however, other agronomic reasons and weather issues play a large role in the impact of crop rotations as well.
Source : illinois.edu