By Gary Schnitkey and Nick Paulson
Department of Agricultural and Consumer Economics
University of Illinois
Carl Zulauf
Department of Agricultural, Environmental and Development Economics
Ohio State University
A price is generally used in determining the rent from variable cash rent arrangements. Common price alternatives include crop insurance, forward, and cash prices. We examine averages from 2009 to 2022 for four price alternatives, finding that averages do not vary much between the alternatives. Relatively small changes in rent factors result in the same rent over time. However, the choice of a price will matter for a specific year.
Prices Used in Variable Contracts
A variable cash rental arrangement typically has a fixed base cash rent paid to the landowner regardless of crop revenue. An additional amount is paid when a rent factor times crop revenue exceeds the fixed base rent, where crop revenue equals yield times price. The cash rent then equals:
rent factor x yield x price
when the result of the above formula exceeds the base rent. We suggested rent factors in central Illinois of 32% for corn and 43% for soybeans (see farmdoc daily, September 20, 2022). To illustrate, take a base cash rent of $250 per acre, a corn yield of 240 bushels per acre, and a corn price of $5.00 per bushel. Given a 32% rent factor, the above formula generates a rent of $384 per acre (.32 rent factor x 240 yield x $5.00 price). In this case, an additional $134 per acre payment above the $250 base rent is made.
Several different prices can be used in the above formula. We examine the following four sets of prices which are commonly used:
- Projected prices for crop insurance. The projected prices are the average settlement prices during February of Chicago Mercantile Exchange (CME) contracts. The December contract is used for corn, and the November contract is used for soybeans
- Average of projected and harvest prices for crop insurance. Harvest prices are the average of settlements during October. Use of the projected and harvest prices represent conditions in both spring and fall.
- Cash prices during the year. Most leases use an extended period to capture prices closer to a season average. We use a period from April to October, a period that roughly coincides with the full production period from planting through harvest. Sensitivity to the period will be presented.
- Forward and cash prices. Rather than using cash prices, forward prices are used before harvest and cash prices after harvest. In this analysis, forward prices represent the price farmers can set for grain for delivery at harvest. We again use an April to October period, with forward prices used for months from April to August.
We will present average prices from the above approaches, thereby assessing the impacts of different choices on rents from variable cash leases.
Prices
Table 1 shows prices used in the analysis, which are averages from 2008 to 2022. More corn was used in ethanol production beginning in the mid-2000s, resulting in higher prices after the mid-2000s than before the mid-2000s. As a result, we begin the analysis in 2008, thereby focusing on higher prices from the ethanol build.
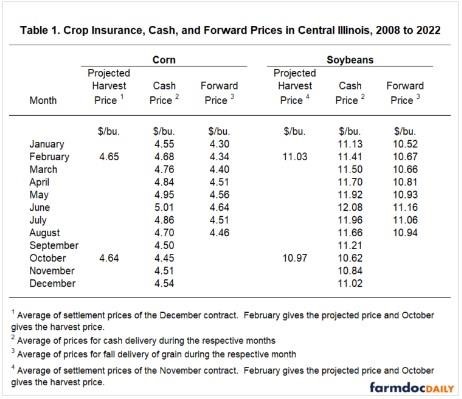
From 2008 to 2022, corn’s projected and harvest prices average $4.65 and $4.64, respectively, very close to one another. Similarly, soybeans’ projected and harvest prices average $11.03 and $10.97, respectively. Again, efficient markets suggest average prices will be similar for the same futures contract at different times in its trading life.
Table 1 also shows average monthly cash and forward prices for corn and soybeans. We use average prices for a month in our calculations. Prices in Table 1 are from central Illinois. Different areas will have different cash and forward prices, which can be quantified by the basis — the difference between futures and cash prices. For example, for corn, futures prices average $.30 higher than forward prices during February ($4.65 projected price, which is the average February settlement price minus the $4.34 forward price for February). For soybeans, futures prices average $.36 higher than forward prices ($11.03 projected price minus $10.67 forward price) in February.
There is a seasonality to cash and forward prices (see Figure 1). From October low prices, monthly average corn and soybean prices tend to increase until June, reflecting storage costs. Prices typically fall after June as the condition of the upcoming crop becomes more certain. Of course, any year can deviate from the trend shown in Figure 1.
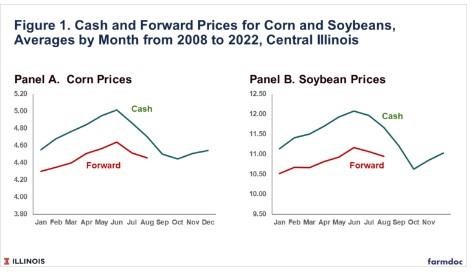
Forward prices exhibit the same seasonal patterns but at lower levels. The forward prices shown in Figure 1 are for delivery at harvest. Because harvest tends the lowest price of the year, forward prices average below cash prices for months other than in the fall.
Average Prices
Of the approaches used, cash prices have the highest average for both corn and soybeans: $4.76 for corn and $11.59 for soybeans (see Table 2).
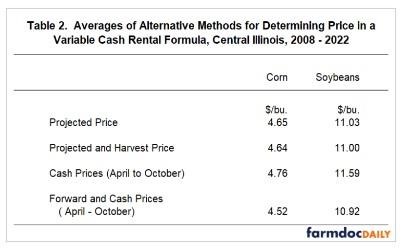
For corn and soybeans, the use of crop insurance prices results in a lower average than cash prices. For corn, the projected price averaged $4.65, $.11 lower than the average cash price. For soybeans, the projected price averages $11.03, $.56 lower than the average cash price.
Including forward prices results in lower average prices. The average of forward and cash prices for corn is $4.52, $.13 below the average of the projected prices. For soybeans, the average of forward and cash prices is $10.92, $.09 lower than the average of the projected prices.
While different, the averages are relatively close to one another and require minor modifications in the rent factor to result in the same cash rent. For example, take a 240 bushel per acre yield and a 32% rent factor the $4.35 average projected price. The rent is $357 per acre (.32 x 240 yield x $4.65 price). Rent factor to result in a $357 per acre rent for the other prices are:
- 32.1% for projected and harvest prices (.321 x 240 yield x $4.64 price).
- 31.2% for cash prices (.312 x 240 yield x $4.76 price).
- 32.9% for forward and cash prices (.329 x 240 yields x $4.52 price).
For these four sets of prices, the range in the rent factor which results in the same average rent level is from 31.2% to 32.9%
For soybeans, take an example of a 70-bushel yield and a 43% rent factor. Using the $11.03 average projected price results in a $332 per acre cash rent. Rent factors resulting in a $332 per acre rent for the other prices are:
- 43.1% for projected and harvest prices (.431 x 70 yield x $11.00 price).
- 40.8% for cash prices (.408 x 70 yield x $11.59 price).
- 43.0% for forward and cash prices (.430 x 70 yield x $10.59 price).
For these four sets of prices, the range is from 40.9% to 43.4%.
The above presents averages from 2008 to 2022. In any given year, using a different price could result in a very different rent level.
Months in the Formula
We used a period from April to October to determine the rent factor. Adding months before April tend to lower the average slightly. Take cash corn with a $4.76 average for April to Oct. The average remains the same if March is included, declines $.01 to $4.75 if the February to October period is used, and declines $.03 to $4.73 for a January to October period.
Adding November and December also lowers the average. Take cash soybeans with an $11.59 average from April to October. The average declines by $.09 to $11.50 if an April to November period is used and $.14 to $11.45 for an April to December period is used.
Summary
The type, period, and duration of prices used in variable cash rental arrangements will influence rental payments. If the spring period is included, cash prices typically have higher prices than crop insurance prices. Crop insurance prices are higher than the forward and cash price alternative. Slight adjustments in rental factors can account for differences in prices.
We report averages for an extended period. For any year, the choice of prices can greatly impact cash rents resulting from a cash rental formula.
Source : illinois.edu