By Bradley Zwilling
Illinois FBFM Association and
Department of Agricultural and
Consumer Economics
University of Illinois
Data from the Illinois Farm Business Farm Management (FBFM) Association for 2013 through 2022 was used to analyze selected differences between the highest profit grain farms (high one-third) and the lower profit grain farms (low one-third). The farms were sorted into thirds based on production per dollar of non-feed costs (accrual gross farm returns divided by total non-feed costs). The analysis was done using the 2013 through 2022 ten-year average. Farms in the higher profit group were larger, had higher corn yields, crop-shared a larger percentage of their acres, and had higher crop returns and lower costs, especially crop and power and equipment costs. Management returns, an economic profit measurement, were significantly greater for the higher profit farms.
Farms are grouped by region in the state – north, central, and south (roughly using Interstate 80 in the north and Interstate 70 in the south). The central region is also divided into a group of higher productive soils and a group with less productive soils. All farms were at least 500 tillable acres in size with the larger average number of acres per farm in northern and southern Illinois. These farms also had none or very limited livestock enterprises.
Farm Size
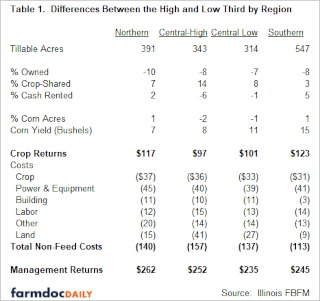
Farm size seems to be a contributing factor to the profitability as the higher profit farms were larger, generally from 300 to 550 more acres (Table 1) depending on the period and the region in the state. The larger farms can spread their labor and machinery costs over more acres contributing to lower costs per acre and higher profitability. When looking at the ten-year average the largest difference in tillable acres is in southern Illinois with 547 more acres for higher profit farms, while the smallest difference was for the central Illinois farms with the lower soil rating with 314 more acres.
Corn Yield & Rotation
The higher profit farms generally had higher corn yields. For the most recent ten-year period, the higher profit farms had higher corn yields ranging from 7 bushels per acre more in northern Illinois to 15 bushels per acre more in southern Illinois. The higher corn yields were a main factor for crop returns being $97 per acre in central Illinois with higher rated soils to $123 per acre higher in southern Illinois for the higher profit farms for the ten-year average from 2013 to 2022.
For the 2013 through 2022 average, northern and southern Illinois higher profit farms had one percent more of their tillable acres planted to corn, while central Illinois higher profit farms had one to two percent less of their tillable acres planted to corn.
Expenses
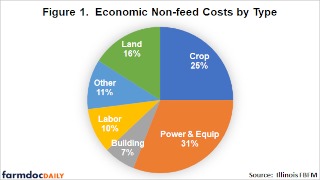
All economic non-feed expense categories were analyzed in the study which include crop, power and equipment, building, labor, other and land. Crop costs include fertilizer, seed and pesticides. The main power and equipment costs are fuel, repairs, machine hire and lease expense and economic machinery depreciation. Drying, storage, building repairs and economic building depreciation compose the building costs. Labor costs are actual employee costs as well as an economic charge for unpaid operator and family labor. The main other costs are insurance, economic interest charge on non-land assets and miscellaneous expenses. Finally, land costs include cash rent, real estate taxes, economic interest charge on owned acres and an estimation for costs association with farming non-revenue acres (landlord share) in a crop-share arrangement.
Crop costs on average made up about 25% (Figure 1) of the total non-feed costs for the 2013 to 2022 ten-year average. These costs were $31 to $37 per acre less for the different regions for the 2013 through 2022 average for higher profit farms. The largest share (31%) of expenses was power and equipment costs. They ranged from $39 to $45 per acre less for the ten-year average comparison. The next largest expense category was land costs at 16 percent. Of these three main costs, land costs varied the most among regions, going from $9 per acre less in southern Illinois to $41 per acre in central Illinois with the higher soil ratings. Total non-feed costs for the most recent ten-year average ranged from $113 less in southern Illinois to $157 per acre less in central Illinois with the higher rated soils.
Management Returns
Economic management returns are measured by taking the accrual net farm income of the operation, subtracting off interest on equity capital and unpaid labor charges. The combination of higher crop returns and lower economic costs per acre result in significantly higher management returns per acre for the higher profitable farms. For the 2013 through 2022 average, management returns were $235 to $262 per acre higher for the higher profit farms.
Source : illinois.edu