By Scott Irwin
Department of Agricultural and Consumer Economics
University of Illinois
The operational efficiency of any industry is key to long-term profitability, no less so for the U.S. ethanol industry. Surprisingly little information is available in the public domain on this important aspect of ethanol production in the U.S. Fortunately, the USDA began publishing the Grain Crushings and Co-Products Production report in October 2014 and this important data source allows us to examine trends in some key industry efficiency measures, including gallons of ethanol per bushel of corn, pounds of dried distillers grain with solubles (DDGS) per bushel of corn, and pounds of corn oil per bushel of corn. The purpose of this article is to compute these measures at the aggregate level for the U.S. ethanol industry and to examine trends in the measures over time. This is an update of the analysis of operational efficiency published last year (farmdoc daily, January 20, 2021).
Analysis
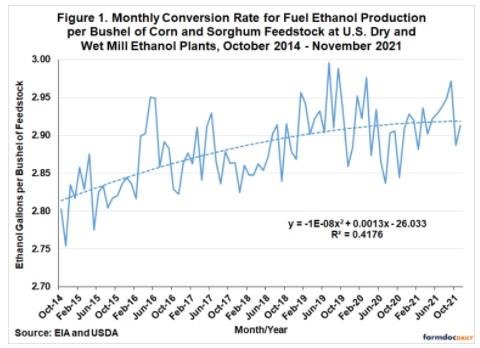
The first operational efficiency measure that we compute is the gallons of ethanol produced per bushel of feedstock processed. We compute this measure by dividing monthly fuel ethanol production from the EIA by the bushels of corn and sorghum feedstock used at U.S. dry and wet mill ethanol plants from the USDA’s Grain Crushings and Co-Products Production report. Both corn and sorghum feedstock are included in the denominator because fuel ethanol production estimates from the EIA do not distinguish between feedstock used to make the ethanol. The amount of sorghum is usually quite small, typically no more than five million bushels per month, and no sorghum use has been reported since July 2020. By comparison, the amount of corn used in ethanol production generally is in the range of 400 to 450 million bushels per month.
Figure 1 shows the resulting aggregate monthly conversion rate for ethanol per bushel of corn and sorghum feedstock from October 2014 through November 2021, the latest month for which data is available. There is a clear upward trend over time, with the ethanol conversion rate steadily increasing from around 2.80 in late 2014 to a peak near 3.00 in mid-2019. This represents a about a 9 percent total increase in efficiency, or a gain of roughly 1.8 percent per year. Since the 2019 peak, the trend in the ethanol conversion rate has been flat at just above 2.90. There was a notable dip in the conversion rate during the initial stages of the coronavirus pandemic, but then the rate recovered steadily to a peak of 2.98 in September 2021. Still, the overall pattern has been no growth in the ethanol conversion rate since mid-2019.
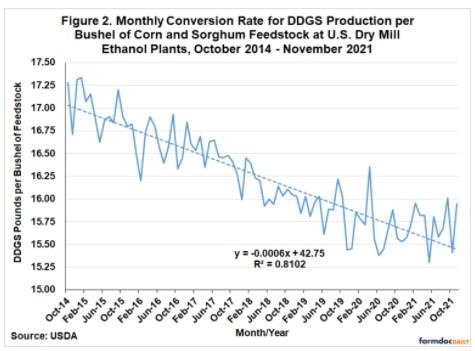
The second operational efficiency measure is the pounds of DDGS produced per bushel of corn and sorghum processed. Computing the pounds of DDGS produced is complicated by the different types of distillers grains that are produced by dry mill ethanol plants. We focus on dry mill plants in order to avoid the additional complication of aggregating corn germ and gluten meal from wet mill ethanol plants with by-product from dry mill plants. The Grain Crushings and Co-Products Production report lists five categories of distillers grain co-products for dry mill plants, so assumptions are needed in order to aggregate the different categories on a dry matter equivalent basis. We assume that condensed distillers solubles and distillers dried grains are components of DDGS so we simply sum these two categories without adjustment and add them to DDGS production. We then adjust distillers wet grains with 65 percent or more moisture and modified distillers wet grains with 40 to 65 percent moisture to an equivalent dry matter for DDGS. Since DDGS has 10 percent moisture as a standard, we multiply the quantity of distillers wet grains with 65 percent or more moisture by 0.45 =1–(0.65-0.10) and modified distillers wet grains with 40 to 65 percent moister by 0.7 = 1–(0.40-0.10). We use conservative assumptions for moisture content in order to avoid under-estimating DDGS production on a dry matter equivalent basis.
Figure 2 shows the resulting aggregate monthly conversion rate for DDGS per bushel of corn and sorghum feedstock from dry mill ethanol plants over October 2014 through November 2021. Just the opposite of ethanol conversion rates, there is a clear downward trend in DDGS conversion rates until very recently. The DDGS rate starts at 17.34 pounds per bushel of corn in October 2014 and then declines systematically throughout the sample period, reaching a low of 15.30 pounds in May 2021. This represents a 2.04 pound drop in DDGS production per bushel of corn, or a 12 percent decline. Notice that the linear trend regression shown in Figure 2 explains slightly more than 81 percent of the variation in the DDGS conversion rate. While the coronavirus pandemic did very little to interrupt this downward trend, there has been a clear interruption of the slide in the rate during the second half of 2021. For the time being, the DDGS conversation rate has stabilized around 15.75 pounds.
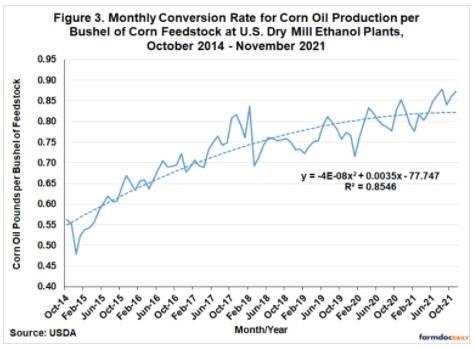
The third measure of operational efficiency is the pounds of corn oil produced per bushel of corn processed. This is straightforward to compute as both components are reported directly in the Grain Crushings and Co-Products Production report. The corn oil measure of operational efficiency shows a non-linear trend over the sample period, with a period of very rapid growth from late 2014 through early 2018 and more modest growth thereafter. From the trough in December 2014 to the peak in August 2021 the corn oil conversion rate increased from 0.48 to 0.88 pounds per bushel of corn processed, or an increase of 83 percent. It appears that this measure of operational efficiency took another upward jump in 2021.
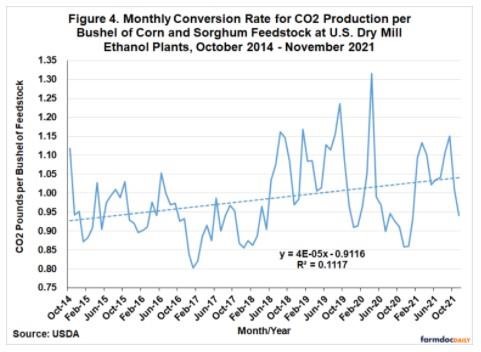
The fourth measure of operational efficiency is the pounds of CO2 produced per bushel of corn and sorghum processed. This is again straightforward to compute as both components are reported directly in the Grain Crushings and Co-Products Production report. The CO2 measure of operational efficiency is characterized by high volatility, with a peak of 1.32 pounds and a low of 0.80 pounds. There is a small upward trend over time, which mainly reflects a jump in the conversion rate that occurred in mid-2018. Nonetheless, the trend in the CO2 conversion rate over time is small compared to the other rates examine here.
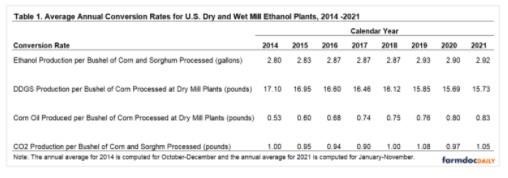
The picture that emerges from this analysis is one of tradeoffs in operational efficiency. These tradeoffs are most easily seen in Table 1, which presents annual averages for the four measures of operational efficiency for ethanol production. Ethanol producers have clearly increased ethanol and corn oil conversion rates at the expense of DDGS conversion rates. Presumably, this was a rational response to the available technology for increasing production efficiency and the economic incentives for production of ethanol and corn oil versus DDGS.
Implications
Recent trends in the operational efficiency of the U.S. ethanol industry are analyzed in this article. There is a clear upward trend over time in ethanol conversion rates, which steadily increased from around 2.80 gallons per bushel of corn and sorghum in late 2014 to a peak near 3.00 in mid-2019. This represents about a 9 percent total increase in efficiency, or a gain of roughly 1.8 percent per year. Since the 2019 peak, the trend in the ethanol conversion rate has been flat at just above 2.90 gallons. Just the opposite of ethanol conversion rates, there is a clear downward trend in dried distillers grains with solubles (DDGS) conversion rates over time. The DDGS rate starts around 17.25 pounds per bushel of corn in 2014 and then declines to a low of 15.30 pounds in May 2021. The most rapid gain in operational efficiency is associated with the corn oil conversion rate. From the low in December 2014 to the peak in August 2021 the corn oil conversion rate increased from 0.48 to 0.88 pounds per bushel of corn processed, or an increase of 83 percent. The overall picture is one of tradeoffs in operational efficiency. Ethanol producers have clearly increased ethanol and corn oil conversion rates at the expense of DDGS conversion rates. Presumably, this was a rational response to the available technology for increasing efficiency and the economic incentives for production of ethanol and corn oil versus DDGS.
Source : illinois.edu