By Lisa Behnken
Performance comparisons of early (1.3-1.8) and late (1.9-2.4) maturity glyphosate tolerant/RoundUp Ready soybean in southeastern Minnesota are now available. The studies with 24 early-maturity and 25 late-maturity entries were conducted near Rochester, MN (Lawler site) on a Port Byron silt loam. Trials were planted on May 5, 2016 with a 4-row John Deere 7000 planter equipped with cone units. The seeding rate was 150,000 seeds per acre with seed planted at a depth of 1.5 inches in 30 inch rows. Plots were four rows wide by 22 feet in length and the center two rows of each plot were machine harvested on October 4, 2016.
Power in study design
The power of our research is that we replicate the trial to help take out effects due to variability across the field (e.g. soil type, drainage, topography, etc.). Each variety is randomly placed into each block (replication) and this is called a randomized complete block design. In our study, we used four blocks (replications), which is considered the standard for field research. In the tables that follow, moisture and yield results followed by the same letter are not statistically different.
What do the letters in the table mean?
For varieties that are followed by the same letter, we would not expect to see a difference in yield in the field. Even though the average yield for a couple of varieties may be numerically different by a few bushels, there was enough variability in the yields across replications that no real trend could be found. Consider a comparison between variety X vs Y. If variety X yielded more than Y in two plots, and Y more than X in the others, these likely would come out statistically the same. In another example, variety X may outyield Y in one replication by quite a bit, but then yield less than Y in the other 3 replications. Here again, these likely would not be statistically different, although the average yields may come out numerically different.
The LSD is the "least significant difference" or the minimum difference in yield we need to see before we can say with confidence that there is a true difference in yield between a pair of varieties. When there is more variability in yield across a plot, the LSD value will go up. The p value (P in the tables below) indicates the probability or confidence we have that two entries differ in yield when the difference is equal to or greater than the LSD. When the P = 0.10, this indicates that we can be 90% confident that variety X performs better than variety Y if the yield difference is equal to or greater than the LSD. Likewise, if P = .20, we have 80% confidence that two varieties differ in yield when the yield difference is equal to or greater than the LSD. For variety trials, a p value of .10 or .20 are considered standards.
Soybean yield results
Tables 1 and 2 provide the yield for the early maturity entries at 13% moisture by entry and yield rank, respectively. Early maturity soybean yield average was 76.3 bu/a with a range of 81.0 – 71.4 bu/a. Tables 3 and 4 provide the yield for the late maturity entries at 13% moisture by entry and yield rank, respectively. Late maturity soybean yield average was 77.4 bu/a with a range of 83.4 – 64.1 bu/a.
Note in Table 2 (listed by rank): The highest yielding entries have the letter "a" after the yield value. RENK RS153NR2 has a yield of 81.0 bu/a followed by the letter "a". All other entries with the letter "a" after the yield value are statistically the same as RENK RS153NR2.
Some entries have more than one letter, like "ab" or "a-d." What does this mean? Entries with the same letter(s) following the yield are not statistically different from each other. For example, STINE 14RD62 has a yield of 77.9 followed by the letters "a-d." This means that the STINE 14RD62 yield of 77.9 is statistically the same as the RENK RS153 NR2 with 81.0 bu/A (both have the letter "a" after the yield). It also means that the STINE 14RD62 yield of 77.9 is not statistically different from all entries followed by an "a, b, c, or d." Therefore, it's not statistically different than LEGEND 17R654N at 74.1 bu/A, which is followed by letters "def," because both yields values are followed by the letter “d.”
Many of the entries/varieties performed very well and there are not big differences. Yield is one of the primary things to consider when choosing a variety. However, take time to evaluate other replicated, reliable trial results for consistency of a variety’s performance and also consider other key agronomic traits such as maturity, SCN, disease scores, etc. when choosing varieties for your farm. Stay tuned for more updates. (University of Minnesota Extension Regional Office, Rochester, and Southern Research and Outreach Center, Waseca, MN).
Table 1. Early maturity (1.3-1.8) soybean yield results (13% moisture) by entry number from Lawler farm, Rochester, MN, harvested October 4, 2016.
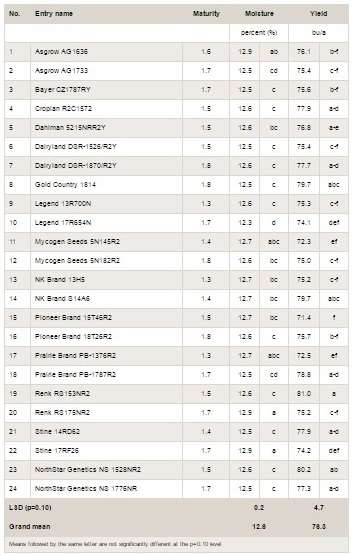
Table 2. Early maturity (1.3-1.8) soybean yield results (13% moisture) ranked from Lawler farm, Rochester, MN, harvested October 4, 2016.
Table 3. Late maturity (1.9-2.4) soybean yield results (13% moisture) by entry number from Lawler farm, Rochester, MN, harvested October 4, 2016.
Table 4. Late maturity (1.9-2.4) soybean yield results (13% moisture) ranked from Lawler farm, Rochester, MN, harvested October 4, 2016.