By Michael Langemeier
Center for Commercial Agriculture
Purdue University
Metrics that can be used to measure farm profitability include earnings before interest, taxes, and amortization (EBITA), net farm income, the operating profit margin ratio, return on assets, and return on equity (Langemeier, 2020). Each of these measures has its advantages and disadvantages. When focusing on whole-farm profitability, net farm income is typically used. When focusing on margins or rates of return and we want to include capital gains on assets in our financial performance metrics, return on assets and return on equity are typically used. This article examines trends in net farm income and return on assets and its components for the U.S. farm sector.
Net farm income is used to cover owner withdrawals (e.g., family living expenditures), to make principal payments on noncurrent debt, and to replace or purchase assets. Net farm income does not include capital gains on land. Increases in net worth, on the other hand, can be due to retained earnings (i.e., the portion of net farm income retained in the business) and/or capital gains on land. Because owned land is such an important asset on farm balance sheets (Langemeier, 2022), over time, the portion of earnings coming from capital gains on land is not trivial. Thus, there are two important sources of income: current income and capital gains. Current income is represented by rental payments (e.g., share rent, cash rent) for non-operator landlords and by the net return to land for farm operators. Capital gains (losses) represent annual increases (decreases) in land values.
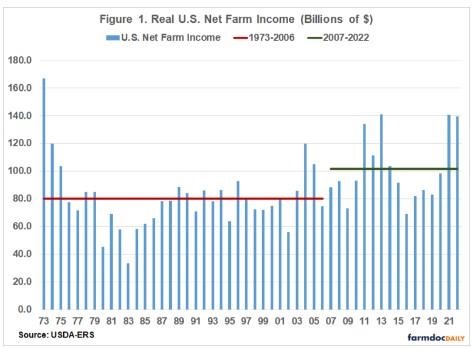
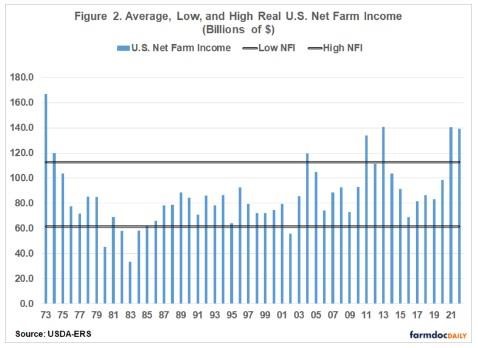
Data in this article were obtained from information reported by USDA-ERS, which includes both net farm income and rates of return. Figure 1 illustrates U.S. real net farm income (in 2021 $) from 1973 to 2022. The estimate for 2022 was made in early September so it represents a projected or forecasted value. Long-run averages for the 1973 to 2006, and the 2007 to 2022 periods are also presented in Figure 1. The average real U.S. net farm income for the 1973 to 2006 period was $80.3 billion, while the average for the 2007 to 2022 period was $101.7 billion. From 2014 to 2020, U.S. real net farm income was below the average since 2007. The values for 2021 and 2022 are well above the long-run averages, and compare favorably with the high net farm incomes experienced from 2011 to 2013. To better gauge the relative strength of net farm incomes in 2021 to 2022, Figure 2 presents real U.S. net farm income as well as net farm income plus or minus one standard deviation. Years for which net farm income was one standard deviation or above the average net farm income from 1973 to 2022 (i.e., $87.1 billion) were as follows: 1973, 1974, 2004, 2011, 2013, 2021, and 2022. Notice that the 2021 and 2002 values are included in the list. Having said that, it is important to note that the net farm income for 2022 is a forecast.
Return on assets (referred to as total rate of return on farm assets by USDA-ERS) is equal to current income (referred to as the rate of return on farm assets from income by USDA-ERS) plus capital gains (referred to as the rate of return on farm assets from capital gains by USDA-ERS). Current income represents the annual returns to farm sector assets from current farm operations. Specifically, what we are referring to as current income in this article is computed by adding interest expense and subtracting unpaid labor and management from net farm income and dividing the result by average total assets. Capital gains (losses) measure the returns to farm sector assets from an increase (decrease) in the value of assets, apart from their income generating potential, and is computed on an annual basis.
Figure 3 illustrates the components of return on assets for the U.S. farm sector from 1973 to 2022. The average return on assets during this time period was 7.5 percent. This rate of return can be disaggregated into current income and capital gains. Current income and capital gains averaged 2.7 and 4.8 percent, respectively, over the 1973 to 2022 period, which indicates that approximately 64 percent of the return on assets for the U.S. farm sector was derived from capital gains. The average return on assets in 2021 and 2022 were approximately 12 percent, with over three-fourths of this return coming from capital gains. Historically, rates of return were higher in 1973, 1975, 1976, 1978, 1979, 2004, 2005, and 2012.
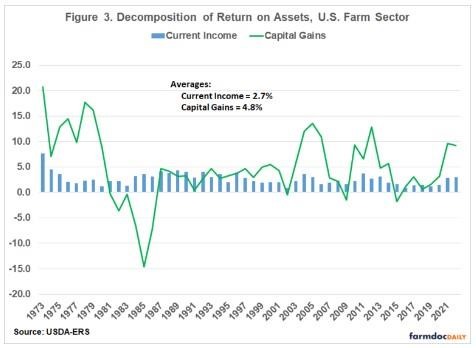
From Figure 3, it is evident that the annual capital gain was considerably more variable than current income. The standard deviation of current income and capital gains was 1.2 and 6.4 percent, respectively. Relative variability can be computed by dividing the standard deviation by the average for each measure. This computation is referred to as the coefficient of variation. The coefficient of variation for return on assets was 0.91. For current income and capital gains, the coefficient of variation was 0.46 and 1.33. These results suggest that a large proportion of the variability of return on assets is due to capital gains and losses. We can also gauge relative variability by examining downside risk. Only 5 of 50 years exhibited a negative return on assets during the 1973 to 2022 period. Capital gains were negative for 9 of the 50 years or 18 percent of the years. In contrast, annual current income was positive for each year. Of course, for individual farms, current income would not be positive every year.
In summary, U.S. net farm income since 1973 has averaged $87.1 billion and the return on assets for the U.S. farm sector has averaged 7.5 percent. Approximately two-thirds of the return is due to capital gains and losses on assets. The other one-third is derived from current income. Though it represents a larger contributor to return on assets than current income, capital gains on assets are considerably more variable than current income. Moreover, capital gains are not readily available to meet financial obligations, purchase assets, or remunerate operators. Thus, the old adage, farms are cash poor and asset rich. A future article will contrast the national financial performance with results for a specific region of the country as well as decompose current income into the operating profit margin ratio and asset turnover ratio.
Source : illinois.edu