By Carl Zulauf
Department of Agricultural, Environmental and Development Economics
Ohio State University
By Nick Paulson andGary Schnitkey
Department of Agricultural and Consumer Economics
University of Illinois
The increase in cost to produce crops since 2020 has focused attention on the net return margin between gross revenue and cost of production. This analysis finds that change in revenue has a notably closer relationship to change in margin than does change in price. US commodity programs use either price (i.e. Price Loss Coverage (PLC)) or revenue (Agriculture Risk Coverage (ARC) to trigger payments. This analysis implies revenue is a better policy variable than price for addressing financial stress due to low or negative margins.
Data and Methods
The analysis uses the cost of production data set maintained by USDA, ERS (US Department of Agriculture, Economic Research Service). It currently covers the 1975-2022 crop years. Crops included in the data set since 1975 are barley, corn, cotton, oats, peanuts, rice, sorghum, soybeans, and wheat. We use the cost of production data for the US. This data can also be thought of as the cost of production for the average producer of the crop in the US.
Net return margin equals gross revenue minus total economic cost of production (See Data Note 1). USDA, ERS assigns a cost to all inputs, including an opportunity cost for owned land and unpaid labor. Hence, it is an economic cost of production. We specifically calculate the share of the change in margin explained by the change in price and change in revenue. Explained share, or explanatory power, is the squared correlation between change in margin and change in price or revenue. Change is examined instead of level because price and revenue have trended higher over time. Trends in variables can result in misleading correlations. Moreover, change is often of more interest, such as when margin declines notably. The explanatory power calculated in this analysis is unconditional since there is only 1, not multiple explanatory variables. Commodity programs are also unconditional since they use a single metric, price (i.e. PLC) or revenue (i.e. ARC) to trigger payments.
Individual Crop -1-Year Change
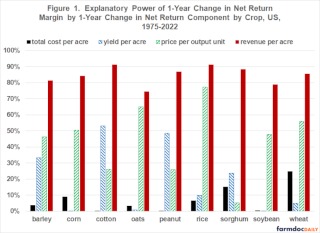
For each of the 9 crops, change in revenue explains a higher, often notably higher, share of change in margin than does change in price (see Figure 1). Explanatory power of change in revenue ranges from 83 percentage points (pp) higher for sorghum (88% -5%) and 65 pp higher for cotton to 14 and 9 pp higher for rice and oats, respectively. For comparative purposes, explanatory power for change in yield and total cost per acre was also computed. They are much lower, especially relative to change in revenue.
Average Relationship – 1-Year Change
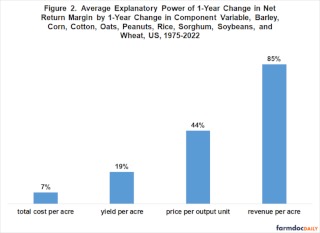
Explanatory power for the individual crops was averaged to obtain the general relationship for the 9 crops. The general relationship is of interest because many features of commodity programs are similar across program commodities. On average, year-to-year change in revenue explains a notably higher share of the year-to-year change in margin than does year-to-year change in price: 85% vs. 44% (see Figure 2).
5-Year Change
To examine the sensitivity of the above results, a correlation was calculated for 5-year change (such as, 2015 to 2020) instead of year-to-year change (such as, 2015 to 2016). Change in input and output prices can follow different time paths with input price change often lagging output price change (see, for example, farmdoc daily April 4, 2023). Differential price change can result in differential change in margin over different time periods. Five years is also a common farm bill length. Perspective is thus provided on explanatory power for a shorter (1 year) and longer period (5 years).
For 8 crops, 5-year change in revenue has a higher explanatory power of the 5-year change in margin than does the 5-year change in price. Explanatory power of the 5-year change in revenue ranges from 57 pp higher for peanuts (77% – 20%) to 6 pp higher for soybeans (82% – 76%). The exception is oats, for which explanatory power is 3 pp higher for 5-year change in price (63% – 60%).
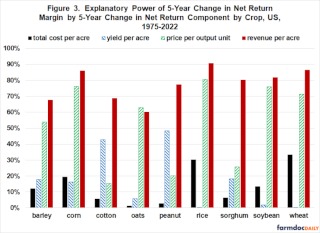
On average for the 9 crops, change in revenue continued to explain a notably higher share of change in margin than does change in price, but the average difference narrowed from 41 pp (85% – 44%) to 24 pp (78% – 54%) (see Figure 4). Average explanatory power for change in total cost and yield per acre remains much lower.
Discussion
Using US data for 9 large acreage field crops, change in revenue is found to more closely track change in net return margin than does change in price over the 47 year period, 1975-2022.
For the 9 crops as a group, change in revenue, on average, explains between 78% and 85% of the change in margin, a high explanatory power especially for a single variable relationship. Change in price explains, on average, 44% to 54% of the change in margin. The range in explanatory power for revenue and price reflects change over 1 and 5 year periods.
Change in revenue explained a higher share of the change in margin, often a much higher share of the change in margin, than did change in price for 17 of the 18 crop and length of change observations examined in this analysis (9 crops and 2 changes of 1 and 5 years).
The closer relationship of change in revenue with change in margin should not come as a surprise. Revenue is a more complete measure of returns than price since revenue also includes yield.
The finding has an important implication for the current farm bill debate. If Congress wishes to increase the efficacy with which current commodity programs address financial stress due to low or negative net return margins, revenue is a better policy instrument than price.
Data Note
USDA, ERS cost of production data includes both revenue from the primary product, such as grain, and secondary products, such as straw. Except for cotton, we use revenue only from the primary product, i.e. its price times its yield, since commodity programs only cover the primary product. For cotton, seed cotton is the program crop, which includes both the value of cotton lint and cottonseed. For a more detailed discussion of USDA, ERS cost of production data, see the 2022 article by Zulauf, Langemeier, and Schnitkey in the Journal of the American Society of Farm Managers and Rural Appraisers.
Source : illinois.edu