By Carl Zulauf and Gary Schnitkey
The decision between RP, crop revenue insurance, and RP-HPE, crop revenue insurance without the harvest price option (HPO) is discussed. RP-HPE has a lower premium and thus a lower cash outflow for premiums since it does not have HPO. The premium subsidy however favors RP as does forward selling. RP-HPE is most attractive to consider when little to none of a crop is sold forward.
Data and Methods
Illinois Farm Business Farm Management (FBFM) yields for corn and soybeans are used if available for the same farm for each year over 1995-2019. Such farms total 847 for corn and 158 for soybeans. Their yields, along with Illinois corn and soybean projected and harvest insurance prices from USDA, RMA (US Department of Agriculture, Risk Management Agency) (see Data Note 1), are used to calculate projected yield and revenue, harvest revenue, insurance payments and premiums, and forward selling gains / losses. These calculations are described in Data Note 2.
Indemnity, Premium, and Average Revenue Per Acre
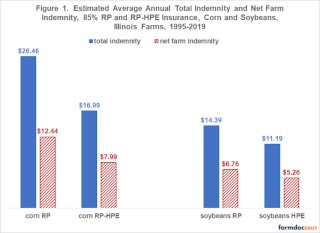
Revenue at harvest equals (harvest yield times harvest insurance price), plus gain / loss on forward sales, plus insurance indemnity minus farm-paid premium. Harvest price and harvest yield are the same for RP and RP-HPE. Thus, for a given share sold forward, harvest revenue for RP and RP-HPE in this study will differ only by their net farm indemnity (insurance indemnity minus farm paid premium). At 85% coverage, net farm indemnity per acre, when averaged across all farms and years, was higher for RP than RP-HPE by $4.45/acre for corn ($12.44 minus $7.99) and by $1.50/acre for soybeans ($6.76 minus $5.26) (see Figure 1). Thus, RP had a higher average harvest revenue by $4.45/acre for corn and $1.50/acre for soybeans. Results are presented for 85% coverage because it is the highest available for RP and RP-HPE and has the most observations with indemnity payments.
Average indemnity will always be higher for RP than RP-HPE at a given coverage level. RP insured value is calculated using HPO, or higher of projected or harvest insurance price. RP-HPE insured value is calculated using only the projected price. If insurance price is lower at harvest, RP-HPE and RP pay the same indemnity. A higher insurance price at harvest reduces RP-HPE’s indemnity. In contrast, because RP uses the higher harvest price to calculate both insured and harvest revenue, its indemnity depends only on yield and thus an indemnity is paid when harvest yield is less than insured yield by more than the deductible. In summary, RP is a hybrid insurance contract: RP-HPE when insurance price declines and yield insurance when insurance price increases.
If insurance is actuarially fair (i.e. premium equals indemnity), premium is always higher for RP than RP-HPE since RP’s average indemnity is higher. Because the Federal subsidy rate is applied to the premium and is the same for RP and RP-HPE at a given coverage level, net farm indemnity is also always higher for RP. Reflecting the 53% Federal subsidy for 85% enterprise insurance (RMA), each net farm indemnity in Figure 2 is 47% of its associated total indemnity (for corn RP, $12.44 is 47% of $26.46). Enterprise insurance is believed to be most commonly purchased in Illinois.
Forward Selling
Forward selling increased revenue more for corn than soybeans (see Figure 2). Projected insurance price (i.e. forward selling price) averaged +5.1% more than the harvest price for corn but only +1.0% more for soybeans. In addition, average yield across all years and farms was 3.3 times higher for corn than soybeans.
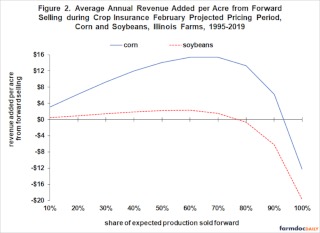
Harvest revenue was highest when 60% to 70% of corn and 50% to 60% of soybeans was sold forward, resulting in around $15/acre more for corn and $2/acre more for soybeans. Selling forward more than these shares reduced revenue per acre because of increasing losses from selling more forward than was harvested. A forward selling shortfall was covered in this study by buying the crop at harvest. A forward selling loss results if harvest price exceeds the forward selling price, which is most likely in drought years. Average largest shortfall of harvest yield from projected yield for all Illinois FBFM farms in this study was -40% for corn and -36% for soybeans. Largest yield shortfall for an individual farm was -82% for corn and -72% for soybeans. When forward selling exceeded 90% for corn and 80% for soybeans, harvest revenue was below projected revenue on average.
Note, forward selling in this study was routine, i.e. a given share was sold forward each year. Varying the share from year to year may increase or reduce revenue from forward selling depending on an individual farmer’s forecasting and trading skills.
Risk
Risk is measured in this study as the largest percent shortfall of harvest revenue from projected, i.e. expected revenue. This percent measure is used because substantial evidence exists that US farmers use expected prices, specifically futures prices, to form price expectations and allocate resources (Gardner; Hurt and Garcia; Chavas, Pope, and Kao; and Eales, et al.). Moreover, revenue per acre increased notably over the analysis period. Percent difference is usually more stable than dollar difference over time, and thus is often a better indicator of performance in the future.
When none of the crop was sold forward, risk on average was lower with RP-HPE than RP insurance for both corn and soybeans, although the difference was not large (see Figure 3). For corn, average largest shortfall in revenue at harvest from expected revenue across all farms was -17.2% for RP-HPE vs. -18.4% for RP, or 1.2 percentage points lower for RP-HPE. For soybeans, the comparable risk measures were -16.9% vs. -17.3%, or 0.4 percentage point lower for RP-HPE.
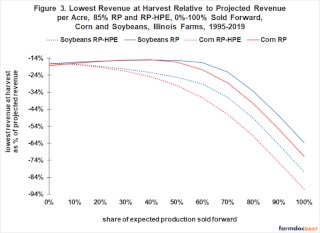
As the share of expected production sold forward increased, risk became less with RP than RP-HPE. At 30% sold forward, RP had an average shortfall in harvest revenue per acre that was -6.3 and -5.0 percentage points lower than RP-HPE for corn and soybeans, respectively. At 50% sold forward, RP’s average risk advantage was -13.5 (-9.9) percentage points for corn (soybeans).
Risk with RP-HPE increased with any forward selling, and increased at an increasing rate as forward selling increased. In contrast, risk declined slightly with RP until forward selling reached 40% for corn and 50% for soybeans, then began to increase at an increasing rate. The large increase in risk as forward selling exceeded 50% is consistent with the previously discussed increasing risk that amount harvested may be less than amount sold forward. Previous research also suggests that selling more than 40% to 60% forward increases risk even when with insurance (see, for example, Dhuyvetter and Kastens; and Walters and Preston).
Discussion
This analysis suggests RP is a better insurance choice than RP-HPE for farmers who have sold or expect to sell before harvest more than 10% of corn and soybean production. On average, revenue is higher and risk is lower with RP when selling forward although cash outflow for premiums is higher.
If forward selling is less than 10%, RP-HPE is an option to consider. On average, revenue per acre is higher with RP, but risk is slightly lower or similar and premium cash outflow is lower with RP-HPE.
The conventional reason for preferring RP over RP-HPE from a risk management perspective is that RP addresses the risk that the amount sold forward can exceed the amount harvested (McKinnon, 1967). Barnaby and Russel (2019) extended the reasoning to any marketing plan requiring a crop at harvest, including on-farm feeding of livestock.
However, this study found that RP is preferred over RP-HPE as a risk management option even at low levels of forward contracting that never came close to being a production shortfall for the study period and farms. This study thus suggests the reason is even broader. Specifically, RP addresses the risk that the forward selling price may be lower than the harvest price when yield is less than expected.
The broadened risk management rationale for preferring RP over RP-HPE prompts a policy question, “Would an insurance product specifically designed for forward selling risk be a better option than RP?” Farmers could buy forward selling insurance only for the share sold forward rather than having to buy RP for their total insured production. A notable reduction in farm paid premiums and Federal subsidies is possible since it is not uncommon for little to none of a crop to be sold forward (Harwood, et al.; Patrick, Musser, and Eckman; Sartwelle, et al.; Mishra and Goodwin; Vergara, et al.; and Velandia, et al.).
Average revenue per acre is always higher with RP than RP-HPE insurance if everything else is the same and insurance is actuarially fair. The higher revenue with RP is due to RP’s higher premium and the policy decision to apply the Federal subsidy to the premium. The preceding prompts a policy question: “Is it appropriate policy that income enhancement rather than risk reduction can determine choice in publically subsidized insurance?” Differential revenue enhancement across insurance contracts can be eliminated by setting premiums for each contract, such as RP and RP-HPE, so that expected net farm indemnity per acre is the same at a given coverage level. The crop insurance decision would then be what insurance contract best addresses the farm risk being insured.
Data Notes
- For crop years prior to 2011, projected and harvest insurance prices were calculated as the average price during February and October, respectively, for the December corn and November soybean futures contract.
- Projected yield is a farm’s linear trend yield for a year estimated by regressing the farm’s yields per planted acre on time. This in-sample trend yield is also the farm’s insured yield. Projected revenue equals (projected yield times projected insurance price). Harvest revenue equals (harvest yield times harvest insurance price), plus forward selling gain or loss, plus insurance indemnity payment minus farm-paid premium. Forward sales are made at the projected insurance price, with per unit gain / loss equal to the harvest insurance price minus projected insurance price. Changes in the cash-futures basis are not considered. If more is sold than harvested, the shortfall is replaced at the harvest price. Crop insurance is assumed to be actuarially fair. Premium thus equals average indemnity paid per acre across all farms and years for a given crop and insurance contract. Premium paid by farms equals the actuarially fair premium times (1 minus Federal subsidy rate). Indemnities paid by RP-HPE and RP are calculated as:
RP-HPE indemnity = MAX [0, (δ ● PP ● YP) – (PH ● YH)], where
- δ = insurance coverage level,
- PP = average futures price during the insurance pre-plant price discovery period,
- YP = insured yield,
- PH = average futures price during the insurance harvest price discovery period, and
- YH = harvested yield.
RP indemnity= MAX [0, ((δ ● MAX [PP, PH] ● YP) – (PH ● YH))].
RP-HPE pays indemnities when insurance harvest revenue is less than insured revenue by more than the deductible. Insured revenue is calculated using only the projected insurance price. RP pays indemnities when insurance harvest revenue is less than insured revenue by more than the deductible. Insured revenue is calculated using the higher of the projected or harvest insurance price.
Source : illinois.edu