By Carl Zulauf
Department of Agricultural, Environmental and Development Economics
Ohio State University
Jonathan Coppess, Gary Schnitkey, and By Nick Paulson
Department of Agricultural and Consumer Economics
University of Illinois
We examine farm safety net payments across states, with a focus on commodity programs. Payments are compared to the value of all field crop production. One would expect payments to be proportional to value of production. In general, commodity payments follow farm production, but exceptions exist. States whose share of commodity payments are higher (lower) than their share of field crop production tend to be in the South (Midwest). We also find (1) the state distribution of all field crop production more closely aligns with commodity programs that pay on historical base acres instead of current production and (2) ARC (Agricultural Risk Coverage) and non-commodity, non-insurance programs are the farm programs whose payments most closely align with field crop production.
Data and Methods
Value of all field crop production is used instead of value of program crop production because the 1996 Farm Bill gave farmers the freedom to plant or not plant base acres to any crop except fruits, vegetables, and wild rice. Commodity payments to base acres can thus fund the production of any field crop, not just program crops. (See the August 24, 2022 farmdoc daily for a discussion of planting flexibility). Value of all field crops is from Quick Stats (USDA, NASS (US Department of Agriculture, National Agricultural Statistical Service)). Field crop acres are also called “principal crop acres.” Farm program payments are from the farm income and wealth data (USDA, ERS (Economic Research Service). Its most recent update (February 7, 2023) contains data by state through calendar year 2021. The analysis starts with calendar year 2002, the first year that CCP (Countercyclical Program) made payments. CCP was authorized by the 2002 Farm Bill as a redesigned price deficiency program, which the 1996 Farm Bill had eliminated.
All Commodity Programs
Government payments, such as commodity program payments, can be considered gross revenue that comes from taxpayers. Value of field crop production is gross revenue that comes from the private market. Comparing the state shares of commodity program payments and value of field crop production provides insights into whether or not the distribution of government payments by state is consistent with the production incentives provided by the private market.
A strong, positive relationship exists between state shares of all commodity program payments and value of all field crop production (see Figure 1). Their correlation is +0.85 (+1.00 is perfect correlation). The two shares however differ notably for some states. Texas has the largest difference: 10.7% of commodity payments vs. 4.2% of field crop production for a 6.5 percentage points (pp) difference. All states identified in Figure 1 have a share difference that exceeds 1 standard deviation (1.4 pp). States whose commodity payment share are at least 1.4 pp higher than its field crop share are in the South. States whose commodity payment share are at least 1.4 pp lower than its field crop share are in the Midwest Corn Belt.

Commodity Program Type
Commodity programs can be categorized by whether they on pay on historical base acre production or current production. Over 2002-2021, commodity programs that paid on base acres were CCP, Price Loss Coverage (PLC), Average Crop Revenue (ACRE), ARC, Production Flexibility Contract (PFC), Direct Payments (DP), and Cotton Transition Assistance. Commodity programs that paid on current production were Marketing Loan (ML), Loan Deficiency (LDP), Certificate Exchange, and Cotton Ginning Cost Share. Not included in this analysis are “buyout” programs associated with ending peanut marketing quotas and tobacco support programs.
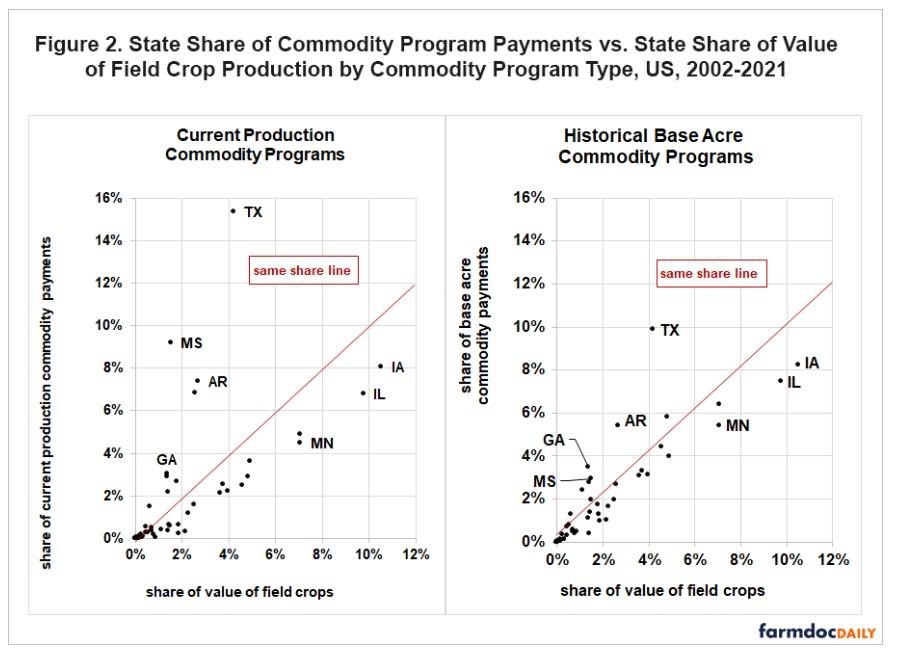
Deviation from the state distribution of value of all field crop production is greater for commodity programs that pay on current production (see Figure 2, left side) than on historical base acre production (see Figure 2, right side). Absolute difference expresses all differences as a positive value. The higher is absolute difference, the more state shares of program payments and field crop production differ regardless of which is higher. Average absolute difference is nearly two times higher for current production commodity programs than for base acre commodity programs (1.3 pp vs. 0.7 pp). Removing Texas does not alter the finding: average absolute difference for current production vs. base acre commodity programs is 1.1 pp vs. 0.6 pp, respectively.
Commodity Program Type
Commodity programs can be categorized by whether they on pay on historical base acre production or current production. Over 2002-2021, commodity programs that paid on base acres were CCP, Price Loss Coverage (PLC), Average Crop Revenue (ACRE), ARC, Production Flexibility Contract (PFC), Direct Payments (DP), and Cotton Transition Assistance. Commodity programs that paid on current production were Marketing Loan (ML), Loan Deficiency (LDP), Certificate Exchange, and Cotton Ginning Cost Share. Not included in this analysis are “buyout” programs associated with ending peanut marketing quotas and tobacco support programs.
Deviation from the state distribution of value of all field crop production is greater for commodity programs that pay on current production (see Figure 2, left side) than on historical base acre production (see Figure 2, right side). Absolute difference expresses all differences as a positive value. The higher is absolute difference, the more state shares of program payments and field crop production differ regardless of which is higher. Average absolute difference is nearly two times higher for current production commodity programs than for base acre commodity programs (1.3 pp vs. 0.7 pp). Removing Texas does not alter the finding: average absolute difference for current production vs. base acre commodity programs is 1.1 pp vs. 0.6 pp, respectively.
Discussion
A common analysis of government program payments is to examine their distribution by geographical area. These analyses usually focus on identifying areas favored by program payments.
This analysis compares the state-by-state distribution of farm safety net payments, with a focus on commodity programs. The state distribution of payments is compared with the state distribution of value of all field crop production. All field crops are used instead of program crops because the 1996 Farm Bill gave farmers the freedom to plant historical base acres that receive program payments to any crop (or no crop) except for fruits, vegetables, and wild rice (i.e. any principal field crop).
Over 2002-2021, the state distribution of farm commodity payments in general followed the state distribution of private market revenue from producing field crops. However some states were advantaged as their share of commodity payments exceeded their share of the private market value of US field crop production. They tend to be in the South. States whose share of commodity payments were less than their share of US field crop production tend to be in the Midwest.
The finding that states that receive a greater share of commodity payments than their share of field crop production s tend to be in the South is consistent with the long-standing, well-known finding that payment per acre has been higher for cotton, rice, and peanuts (for a recent example see the per acre comparison in the January 13, 2022 farmdoc daily).
State distribution of market revenue from field crops more closely aligns with the state distribution of payments by commodity programs that pay on historical base acres rather than on current production. It is thus likely that commodity program payments made on historical base acres are less distortionary of private market incentives than commodity program payments made on current production. Given this finding and implication, the seldom mentioned decline in the role of commodity programs that pay on current production has likely reduced the distortionary impact of farm bill commodity programs, assuming everything else remained the same.
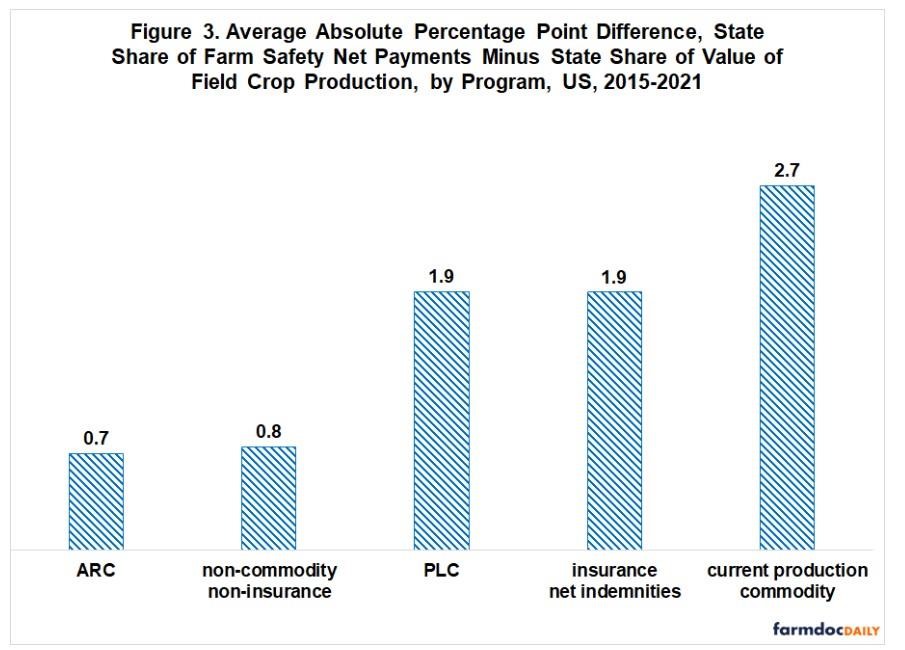
Since enactment of the 2014 Farm Bill, ARC has been the farm safety net program whose distribution of payments by state most closely aligns with the state distribution of field crop revenue. This finding is not surprising since the calculation of ARC payments is primarily based on gross revenue per acre.
What might be surprising is that the state distribution of payments by non-commodity, non-crop insurance farm safety net programs is almost as closely aligned as ARC payments with the state distribution of revenue from producing field crops. This third category of farm safety net programs has included large payments by ad hoc farm assistance programs since 2017. History suggests Congress will try to incorporate large ad hoc payments into farm bill programs (farmdoc daily, July 29, 2020). Findings of this analysis suggest that, if the desire of Congress is to maintain the state distribution of payments by recent ad hoc farm programs, enhancements to ARC would be a strategy for achieving this outcome.
Source : illinois.edu