By Gary Schnitkey and Krista Swanson et.al
Department of Agricultural and Consumer Economics
University of Illinois
Carl Zulauf
Department of Agricultural, Environmental and Development Economics
Ohio State University
The National Agriculture Statistics Service (NASS) recently released county yields. NASS county yields are not the same yields that will be used to calculate Agriculture Risk Coverage at the county level (ARC-CO) payments, or to determine indemnities from the Supplemental Coverage (SCO) and Enhanced Coverage Option (ECO) insurance policies. Still, they provide helpful indicators of the chance of payments. Overall, Illinois farmers should not expect ARC-CO payments for corn or soybeans. ECO at the 95% coverage level could make payments for corn in some counties of northwest Illinois. ECO-95% could pay on soybeans in several southern Illinois counties. ARC-CO, ECO, and SCO likely will trigger payments in many North Dakota, South Dakota, and Minnesota counties.
Corn Yields in Illinois
Figure 1 shows a series of three maps of Illinois counties. The left map, labeled “Actual,” gives 2021 county yields reported by the National Agriculture Statistics (NASS), an agency of the U.S. Department of Agriculture. The highest 2021 yields occurred in east-central Illinois: 222 bushels per acre in Champaign and Moultrie counties. The lowest yield of 164 bushels per acre occurred in Lake County (Northeast Illinois) and Union County (southern Illinois).
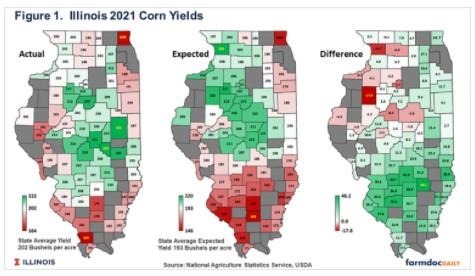
The middle map is labeled “Expected”, giving the expected or trend yields for 2021 before any information was known or realized about the 2021 growing season. If 2021 could be repeated many times, the average of the resulting yields would be close to the trend yield. These trend yields are based on linear regressions of the yields from 1972 to 2020. A 2021 trend yield is then an extension of the trend line fit through data up to 2020.
The right-most map, labeled “Difference,” gives the actual yield minus the trend yields. Counties with above-trend yields had a good year relative to expectations, while those with below-trend had a year below expectations. In Illinois, yields were above expectations in eastern and southern Illinois. The county with the highest difference of 48.2 bushels was Clay County. The actual yield of 210 bushels per acre in Clay County was 48.2 bushels per acre higher than the trend yield of 162 bushels per acre.
In Illinois, yields were below trend in northwest Illinois (see Figure 1). The lowest difference of -17.8 bushels per acre occurred in Knox County. Carroll County, next to the Mississippi River in Northern Illinois had the next largest negative difference at -14.7 bushels per acre.
2021 ARC-CO Payments: Agriculture Risk Coverage at the county level (ARC-CO) is a Commodity Title choice that is a county revenue program. Payments occur when county revenue is below 86% of benchmark revenue. County revenue in 2021 equals 2021 county yield times 2021 Market Year Average Price (MYA) price, neither of which are known. The Farm Service Agency (FSA) does not use NASS yields in its calculation if crop insurance data is available. In these cases, county yields are based on crop insurance data from the Risk Management Agency (RMA). The 2021 MYA price is based on national prices from September 2021 through August 2022.
While not used in FSA calculations, NASS county yields in Figure 1 will provide a good indication if 2021 ARC-CO payments will occur. The March 2022 World Agriculture Supply and Demand Estimate (WASDE) report contained an estimate of the 2021 MYA price at $5.65 per bushel. If the 2021 MYA price is $5.65, then the 2021 county yield must be below 56% of its county yield (see appendix for the derivation of the 56%). None of the differences in Figure 1 would result in an actual yield below 56% of its benchmark yield. Take Knox County, the county with the largest deviation below trend, as an example. Knox County’s ARC-CO benchmark yield is 232.5 bushel per acre, meaning that the 2021 actual yield would need to be below 130 bushels per acre before ARC-CO makes a payment. The 2021 NASS yield is 198 bushel per acre, well above the ARC-CO break-even yield. Therefore, it is extremely doubtful that the county yield for ARC-CO will differ enough from 198 bushels per acre to trigger an ARC-CO payment.
2021 ECO and SCO payments: Crop insurance has two county level products that provide county-level protection above the COMBO products, such as Revenue Protection (RP), RP with harvest price exclusion (RPhpe), and Yield Protection (YP). These options are:
- Supplemental Coverage Option (SCO) protects from 86% down to the coverage level of the COMBO product.
- Enhanced Coverage Option (ECO) provides protection from either 90% or 95% to 86%.
The SCO and ECO option takes the form of the underlying COMBO product. If the underlying product is RP, SCO and ECO; the 2021 insurance guarantee will use the higher of the harvest price rather than the lower projected price.
SCO and ECO payments are not known as the Risk Management Agency (RMA) has not released county yields. RMA’s county yields will be based on crop insurance yields, which will differ from the NASS yields presented above. Still, the differences between actual and trend yields in Figure 1 will indicate differences in RMA yields from RMA expected yields.
For 2021, the projected price was $4.58 per bushel, and the harvest price was $5.37 per bushel. Given the higher harvest price, ECO and SCO with RP as the underlying product will trigger under the following conditions:
- ECO with a 95% coverage level will trigger when the 2021 county yield is below 95% of the expected county yield. Two counties have actual NASS yields below 95% of their expected yields (see figure 1): Knox and Carrol counties. There is a possibility that these two counties trigger payments for ECO-95%.
- ECO with a 90% coverage level will trigger when the 2021 county yield is below 90% of the expected county yield. None of the counties have actual NASS yields below 90% of expected yields.
- SCO will trigger when the actual county yield is 86% of the expected yield. None of the counties have actual NASS yields below 86% of expected yields.
When RP is the underlying product, ECO could trigger in some counties in northwest Illinois since payment is based only on a decline in yield. Similarly, ECO with an underlying YP contract could pay in those same counties. However, ECO with an underlying RPhpe policy likely will not trigger because RPhpe does not have a guarantee increase provision allowing the higher harvest price to be used in the guarantee calculation.
Soybean Yields in Illinois
Figure 2’s format is similar to Figure 1 but shows soybean yields rather than corn yields. As shown in the left map of Figure 2, actual yields ranged from a high of 76.1 bushels per acre for Piatt County (central Illinois) to a low of 43.3 bushels per acre for Johnson County (southern Illinois). Expected yields range from 68.6 for Piatt county to 42.8 bushels per acre for Perry Counties (right map in Figure 2).
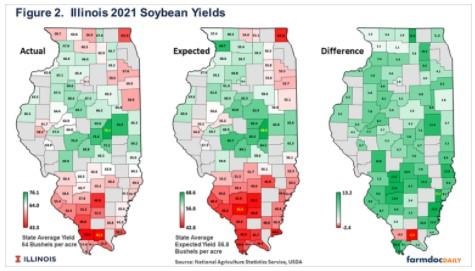
Except for two counties, all Illinois Counties had actual yields above expected. The highest difference of 13.2 bushels per acre occurred in Edwards County (southeast’s Illinois) with a 62.2 actual yield and a 49.0 expected yield, giving the 13.2 difference. The two counties with below trend yields were Union (-.9 bushels per acre) and Johnson Counties (-2.4 bushels per acre).
2021 ARC-CO Payments: The 2021 MYA price projection contained in the March 2022 WASDE report was $13.25 per bushel, above the 2021 ARC-CO benchmark price of $8.95. Given the 2021 MYA price projection, actual county yield has to be below 58% of benchmark yields (see appendix for derivation of .58). Illinois county yields will not have these large yield declines from expected levels.
SCO and ECO Payments: The 2021 harvest price for soybeans is $12.30, above the $11.87 projected price for 2021. As a result, RP-related products will have an increase in their guarantee. Yield shortfalls then can generate SCO and ECO payments. Union and Johnson Counties could trigger payments at the 95% coverage level for ECO, with RP and YP as the underlying product.
National Corn and Soybean Yields
National analyses were conducted similar to that for Illinois. Figure 3 shows the difference between actual and expected values for corn. Those counties in green have actual yields above trend, while red counties suggest yields below trend. Most counties have yields above trend, with notable expectations. The drought that impacted the northern Great Plains is evident, with many counties in North Dakota, South Dakota and Minnesota having yields below 60% of expected yields.
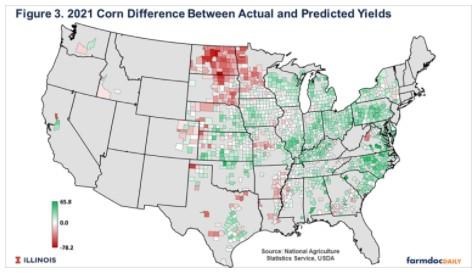
ARC-CO for corn could make payments in many of these North Dakota, South Dakota, and Minnesota counties. Similarly, ECO and SCO could also trigger payments in those counties. Any county with a below-trend yield — counties with red shade — have the potential to receive ECO payments.
Figure 4 shows the difference between actual and trend yields for soybeans. Again, most counties have yields above trend, with notable exceptions. The drought in North and South Dakota is evident, with many counties having actual yields less than 60% of expected yields. Also, counties along the Kansas-Oklahoma border had yields significantly below trend.
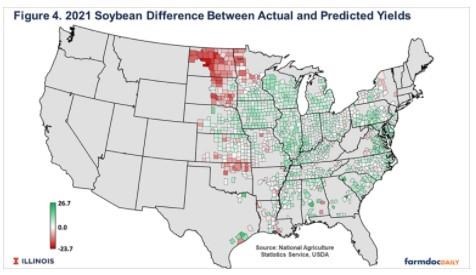
ARC-CO for soybeans could make payments in many North Dakota, South Dakota, and Minnesota counties. Similarly, ECO and SCO could make payments in those counties. Any county with a below-trend yield — counties with red shad — has a high potential to make an ECO payment.
Summary
In Illinois, 2021 corn yields were generally above trend except for counties in northwest Illinois. As a result, it is doubtful that ARC-CO will make payments for corn in Illinois. Similarly, soybean yields were above expected for most of Illinois, and ARC-CO payments should not be expected. ECO could make payments in a small number of counties if purchased at the 95% coverage level with an underlying RP or YP product.
Most of the U.S. had above trend yields for corn and soybeans, with the notable exception of the Dakotas and Minnesota. Yields were low enough in these areas that ARC-CO could trigger payments. ECO and SCO could also make payments in these areas.
Appendix: Calculation of break-even yields ratios for ARC-CO
A yield ratio can be calculated below which ARC-CO will make payments. ARC-CO will make payments when actual revenue is below the guarantee:
.86 x benchmark yield x benchmark price < actual county yield x MYA price
Rearranging terms gives:
.86 x (benchmark price / MYA price) < (actual county yield / benchmark yield)
For corn in 2021, the benchmark price is $3.70 and the March 2021 estimate of the 2021 MYA price is $5.65, giving
.56 < (actual county yield / benchmark yield)
For corn, the actual county yield has to be 56% of the benchmark yield before payments occur.
For soybeans in 2021, the benchmark price is $8.95 and the 2021 MYA price is estimated at $13.25, giving
.58 < (actual county yield / benchmark yield)
For soybeans, the actual county yield has to be 58% of the benchmark yield before payments occur.
The .56 value for corn and .58 for soybeans applies to the entire U.S. Those could change if the MYA differ from March WASDE projections.
Source : illinois.edu