By Greg LaBarge and Steve Culman
During this period of high prices and uncertain availability of phosphorus and potassium fertilizer, a few basic soil fertility concepts can help guide application decision-making. Fortunately, the work during 2014-2020 that led to the Tri-State Fertilizer Recommendation for Corn, Soybean, Wheat, and Alfalfa-2020 is current information we use. Here are a few key points from the Tri-States plus some other principles that may help.
Have a current soil test and use it.
Apply lime if needed
Suspend buildup P and K applications
Prioritize fertilizer application to soil test P and K areas below "critical" value
Use banded placement with a lower rate
P & K in manure equal fertilizer pound for pound to maintain soil values, prioritize low soil test fields for manure
1. Have a current soil test and use it.
What is the best investment when fertilizer prices are high, a recent reliable soil test! What is a recent reliable soil test? A recent soil test is no more than four years old. A reliable test is where you believe the number for pH, phosphorous, and potassium on the soil test represents that field you farm. If you question your soil report numbers, think about changing how you collect samples for soil testing. You want to consider three things: the size of the sampled area, does the sample area represent productivity and using a standardized sample depth. For more information on soil sample collection procedures, see the factsheet at https://go.osu.edu/soilsample.
Recent reliable soil test values for pH, phosphorus, and potassium will tell you if you need to apply lime or fertilizer this year or if we can wait. Comparing your soil test values to the Tri-State Fertilizer Recommendations will answer critical questions about your fertility needs. Get your copy of the Tri-state Fertilizer Recommendations for Corn, Soybean, Wheat, and Alfalfa at https://go.osu.edu/fertilizer. The publication is available for sale as a printed copy or a free pdf version.
2. Apply lime if needed
The first thing to look at on your soil test reports is pH. Soil pH is the critical factor in nutrient availability. If soil water pH is less than 6.0, consider liming before applying fertilizer. When soil pH values are acidic (< 6.0), the lime investment will make more soil stored phosphorus and potassium crop available. Use buffer pH from the soil test report to determine how much lime you need. Apply enough lime to bring soil pH into the 6.5-6.8 range. Spend your first fertilizer dollars on lime.
3. Suspend buildup P and K applications
Buildup nutrient recommendations are recommendations to increase below critical soil tests value and have no yield impact. The total recommendation shown in the Tri-State tables is crop removal plus and added buildup amount for any soil value below critical for the crop. Consider suspending this portion of the nutrient recommendation until we have more favorable fertilizer prices. Table 1 shows the critical soil test values for phosphorus and potassium.
4. Prioritize fertilizer application to soil test P and K areas below "critical" value
You have been using a build maintenance fertilization strategy if you have been following our Tri-state Fertilizer Recommendations for Corn, Soybean, Wheat, and Alfalfa. The build maintain strategy has the pricing and availability situation we are currently experiencing in mind. Comparing your soil test value for phosphorus and potassium to the critical value defines the need for annual fertilizer application. The text from the Tri-State bulletin states, "Soil test values above the critical value are "optimal," unlikely to be responsive to fertilizer application. Soil test values below the critical value are "deficient," more likely to have a yield response to fertilizer application."
Shown in Table 1 are critical soil test values for phosphorus and potassium in corn, soybean, wheat, and alfalfa. In summary, with a build maintenance approach, as long as soil test values are above the critical value, you can defer fertilizer applications when fertilizer prices are high, or weather conditions do not favor application.
Table 1. Critical Soil Test Values from Mehlich 3 Soil Test for Phosphorus and Potassium. (Tri-state Fertilizer Recommendations for Corn, Soybean, Wheat, and Alfalfa, 2020.)
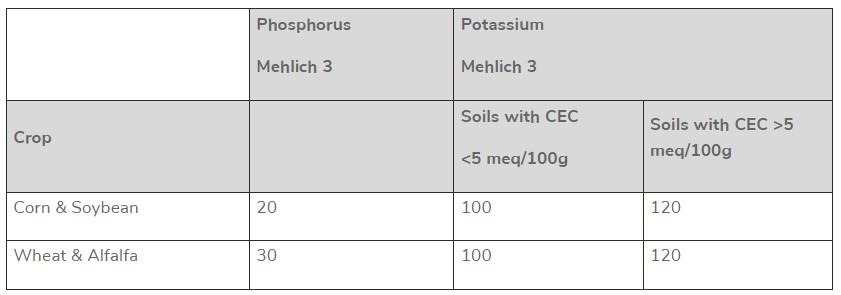
If your crop for 2022 is corn or soybeans, here is how it works. First, scan your soil test reports for less than 20 ppm P soil values. Below 20 ppm is where the risk of yield loss is more likely. Therefore, the recommendation would be to apply a crop removal rate of P. Determine yield potential based on-field productivity. Then multiply the yield potential by the crop removal P rate for the crop. Crop removal is 0.35 pounds P2O5 per bushel for corn, and soybean is 0.80 pounds P2O5 per bushel.
Here is an example. A field (or zone) with a soil test P-value of 15 ppm Mehlich 3, and corn yield is 195 bushels per acre. Therefore, the nutrient needed is 68 pounds P2O5, 195 multiplied by 0.35. The amount of MAP fertilizer required to meet this need is 131 pounds found by taking 68 pounds P2O5 needed dividing by 0.52, which is the P2O5 percentage of MAP, 11-52-0. If you are using DAP, it would be 148 pounds found by taking 68 pounds P2O5 needed dividing by 0.46, which is the P2O5 percentage of DAP, 18-46-0.
Where your soil test reports show soil P values above the 20 ppm critical value, you can defer fertilizer applications to when fertilizer prices are more favorable. However, keep in mind that if your soil test values are near the critical value, you can only defer for a short time. Soil test P values decline over time, but change is not dramatic from one year to the next due to the soil's ability to buffer available P. Estimated change in soil test P values is only 2-3 ppm per year from crop removal.
Decisions for potassium are similar to phosphorus. The difference is we need to look at both the Cation Exchange Capacity (CEC) number and the soil test potassium value. If CEC is less than 5, use 100 ppm Mehlich as the critical value. If CEC is greater than 5, use the 120 ppm value. The crop removal for corn is 0.20 pounds of K2O per bushel, and for soybean, it is 1.15 pounds of K2O. Now scan your soil test reports for K soil values less than the critical value. Below the critical value is the situation where the risk of yield loss is more likely. Therefore, the recommendation would be to apply a crop removal rate of K. Determine expected yield based on-field productivity. Then multiply the expected yield by the crop removal for P for the crop. Crop removal is 0.35 pounds P2O5 per bushel for corn, and soybean is 0.80 pounds P2O5 per bushel.
Continue with our example of a field (or zone) with a 195 bushel per acre corn yield and a soil test K value of 110 and CEC of 15 meq/100g. The K2O need would be 39 pounds per acre. Therefore, the potash fertilizer recommendation would be 65 pounds. Fertilizer need is calculated by taking the 39 pounds K2O needed, divided by 0.60, the K2O percentage of potash, 0-0-60.
Where your soil test reports show soil K values above the critical value, you can defer fertilizer applications to when fertilizer prices are more favorable. However, keep in mind that if your soil test values are near the critical value, you can only defer for a short time. This is because soil test K values decline over time, while K is buffered like P, the soil changes from one year to the next due tend to be greater than with P. Estimated change in soil test K values are 6-10 ppm per year from crop removal for grain crop but are higher with forages.
We provide a spreadsheet that many folks have found helpful to do nutrient and fertilizer calculations. You can see that tool at https://go.osu.edu/ohiofertilitytool.
5. Use banded placement with a lower rate
"For deficient soils, recommended rates of fertilizer should be applied annually. Placement and timing techniques to enhance nutrient availability, such as sub-surface banding, or spring application, may also be beneficial on nutrient-deficient soils. Applying 25 to 50 percent of the recommended fertilizer in a band to enhance early growth should be considered." Tri-State Fertilizer Recommendation for Corn, Soybean, Wheat, and Alfalfa-2020
6. P & K in manure equal fertilizer pound for pound to maintain soil values, prioritize low soil test fields for manure
Livestock manure is a good P & K nutrient source for crop production. There are two things to know when comparing P2O5 and K2O availability in manure to commercial fertilizer. First, the pounds of available P and K nutrient shown on the manure test is equivalent to commercial fertilizer. Therefore, those manure nutrients are a one-to-one replacement for commercial fertilizer. Second, manure is not a good substitute when starter fertilizer is needed. The key to using manure in the fertility program is to get a manure nutrient test, then use that test to guide the application. Application rates should be determined using both the manure source's N and P content, being sure not to over-apply either nutrient.
Source : osu.edu