By Krista Swanson and Nick Paulson et.al
Department of Agricultural and Consumer Economics
University of Illinois
Carl Zulauf
Department of Agricultural, Environmental and Development Economics
Ohio State University
Crop insurance has evolved with the goal of insuring a large share of acres to reduce demand for ad hoc disaster assistance. One of the primary goals of crop insurance is to help farmers manage risks and cover losses in the crop year, thereby eliminating the need for either standing or ad hoc disaster programs. Despite widespread use of crop insurance on many crops, and efforts by the United States Department of Agriculture, Risk Management Agency (RMA) to expand crops and livestock covered by Federal crop insurance, ad hoc disaster assistance programs have been available for all crop years from 2017 to 2021 to support farmers suffering crop losses due to natural disasters. Yesterday we presented disaster assistance background for commodity program crops and information on the new Emergency Relief Program (see farmdoc daily, June 6, 2022). In this article we discuss two key issues relative to disaster assistance programs and crop insurance: 1) crop insurance already covers natural disasters and 2) standing disaster assistance program programs may discourage crop insurance use.
Crop Insurance Coverage in Natural Disaster Situations
Federal crop insurance, part of the existing farm safety net, has a policy objective of providing assistance for declines in yield or price over a crop’s production period. For many crops, farmers have a choice of whether they insure with yield or revenue insurance. Farmers who purchase crop insurance receive an indemnity payment when crop yields or revenues decline beyond the coverage level, including disaster related loss situations.
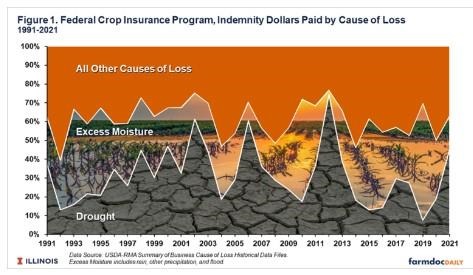
The RMA has tracked cause of loss for crop insurance claims since 1991, publicly available in the Summary of Business Cause of Loss Historical Data Files. In addition to natural disaster causes of loss, there are other causes that can mostly be classified as various biological detriments, other adverse occurrences, and price declines. In most years since 1991, drought and excess moisture alone have accounted for about two-thirds of the total causes of loss, by both the number of policies indemnified and the distribution of indemnity dollars (See Figure 1). Although the past five years have been among the wettest and driest years in history in specific regions of the country, related claims have not been out of the historical norm in that time. Note that crop insurance already provides coverage for any natural disaster that causes yield or revenue losses. By design, WHIP+ and ERP simply add to that revenue or yield coverage.
Legislative action to provide disaster assistance and the design of the programs to expand coverage levels for insured crops and include uninsured crops in disaster areas raises questions about is covered under farm bill commodity programs and crop insurance, what is lacking, and what changes may be made in the next farm bill. For crops that are already part of the crop insurance program, providing a higher coverage level could be accomplished as opposed to a separate disaster assistance program. For crops not included in the current crop insurance program, their inclusion in Wildfires and Hurricanes Protection Plus (WHIP+) program and Emergency Relief Program (ERP) could be a signal for desire to include additional crops as traditional program commodities.
Crop Insurance Coverage Options & Interactions
Disaster assistance programs that build on crop insurance obviously have linkages to crop insurance. Those linkages could, in fact, discourage crop insurance use. Farmers already may have a coverage level in mind when they make decisions. If a disaster assistance program provides a coverage level above that desired level, farmers may in fact cut their insurance coverage when making future crop insurance decisions.
In addition, the disaster program should be designed in a way that does not negate the coverage level offered by crop insurance. A prime example of this issue relates to both WHIP+ and ERP and coverage factors for crop insurance policies with 80% or higher coverage levels. The ERP (and WHIP+) have a 95% coverage factor for both 80% and 85% crop insurance coverage levels. Therefore, a farmer with a qualifying natural disaster loss will receive the same net benefit (crop insurance payments + ERP payments – premium cost) regardless of if 80% or 85% coverage level was purchased initially with the crop insurance policy (see appendix). This reality would likely influence farmers to purchase the lower cost 80% coverage level when making future crop insurance decisions. The same would be true if an individual purchased SCO and ECO.
Summary
Disaster assistance programs will have inter-relationships with crop insurance. Specifically, disaster assistance programs will cover the same causes of loss as those covered by crop insurance, and the presence of disaster assistance programs could reduce purchases of crop insurance. Improper design of a permanent disaster assistance program could offset coverage offered by crop insurance.
Although effort has been made to reduce interactions and overlap with crop insurance through subtraction of indemnity payments and consideration of policy costs in ERP payments, complications in program design and interactions that could disincentivize use of higher coverage crop insurance policies still exist. Although producers may still consider purchasing higher coverage policies, the growing prevalence of natural disaster conditions and expansion of qualifying natural disaster coverages in ERP, make it more likely that lower cost policy options could result in equivalent net benefit. This sets the stage for a relevant policy discussion that will be presented in the farmdoc daily article next Tuesday.
References
Farm Service Agency, United States Department of Agriculture. “Emergency Relief.”
Risk Management Agency, United States Department of Agriculture. “Cause of Loss Historical Data Files.”
Swanson, K., G. Schnitkey, C. Zulauf, J. Coppess and N. Paulson. "The Continuation of Disaster Programs in U.S. Agriculture: Emergency Relief Program." farmdoc daily (12):83, Department of Agricultural and Consumer Economics, University of Illinois at Urbana-Champaign, June 6, 2022.
Appendices
For insurable crops, there are crop insurance interactions issues with ERP. Phase 1 of ERP will make payments to producers who received crop insurance indemnity payments attributed to a natural disaster cause of loss. The ERP coverage factor is related to the crop insurance coverage level. Any crop insurance coverage level of 80% of higher correlates to a 95% ERP factor. One issue is that there are existing crop insurance options that provide coverage levels above 80%, including up to the 95% coverage level that ERP provides. Notably, these higher coverage levels come with a cost to producers. ERP is giving the same 95% coverage level to producers who purchased 80% coverage as those who purchased coverage up to 95% with add-on options.
Standard policies like Revenue Protection (RP) and Yield Protection (YP) provide coverage levels up to 85%. But even more notable, are the issues that arise with use of programs like Supplemental Coverage Option (SCO) and Enhanced Coverage Option (ECO). Both are add-on options for use with an underlying crop insurance product.
A producer can purchase up to a 95% coverage level with a combination of RP+SCO+ECO. As an example, RP with 80% coverage level, plus SCO covering 86% down to 80% when used with RP-80%, plus ECO-95% covering 95% down to 86%. This comes with considerable premium cost.
An example is shown for corn with cause of loss related to drought in Dekalb County in 2021. The farm has a Trend-Adjusted Actual Production History (TA-APH) of 186 bushels per acre and Revenue Protection (RP) as the underlying crop insurance policy. In 2021, the projected price was $4.58. Calculations are shown in Table 1, with the first column giving payments for RP with an 80% coverage level, a second column for RP with an 85% coverage level, and a third column with a three-policy combination of RP at 80% coverage plus SCO plus ECO at 95% coverage.
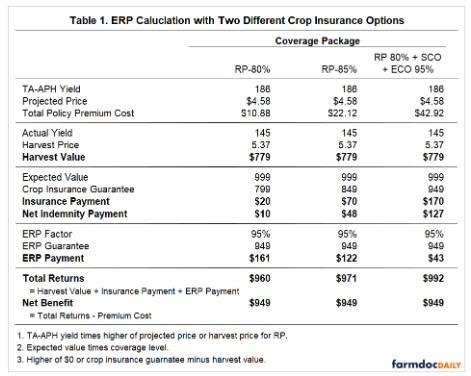
For 2021, the harvest price was $5.37. An actual yield of 145 bushel per acre results in a harvest value of $779 per acre.
The expected value for all coverage scenarios is $999 per acre, calculated as TA-APH yield times the higher of the projected price or harvest price. This expected value will be used to calculate the crop insurance guarantee and ERP guarantee.
The crop insurance guarantee is $799 per acre for RP-80%, $849 per acre for RP-85%, and $949 per acre for RP-80%+SCO+ECO-95%. This results in crop insurance payments of $20 per acre for RP-80%, $70 per acre for RP-85%, and $170 per acre for the three-policy combination, reflecting the difference in harvest value and crop insurance guarantee for each. All three coverage scenarios resulted in indemnity payments making them eligible for ERP.
The ERP factor is 95% for all scenario scenarios, resulting in an ERP guarantee of $949 per acre. To calculate ERP payments, the harvest value and net indemnity payments are subtracted from the ERP guarantee. Net indemnity payments are gross indemnity payments minus policy premiums and fees.
For RP-80%, ERP payments are $161 per acre ($949-$779-$10). For RP-85%, ERP payments are $122 per acre. For the RP-80%+SCO+ECO-95% the ERP guarantee is equal to the 95% guarantee already covered by crop insurance, so the payment equals only the policy premium cost of $43 per acre.
The sum of crop revenue, insurance payments, and ERP payments is highest for the three-policy combination and lowest for RP-80%, but the difference is the cost of the policies. Although ERP payments are adjusted by policy costs to keep RP-80% from getting more advantageous ERP payments compared to the other scenarios, the producer still incurred the expense. When premium cost is subtracted from total returns, all three scenarios end with the same net benefit of $949 per acre. Ultimately these equal because the ERP Factor is 95% for all coverage scenarios. Because these are equal, ERP could be a disincentive to purchase crop insurance policies that result in coverage above the 80% coverage level. When producers have a disaster related cause of loss, the resulting net benefit is the same with a lower up-front cost.
Source : illinois.edu