Carl Zulauf
Department of Agricultural, Environmental and Development Economics
and
Gary Schnitkey, Jonathan Coppess, Nick Paulson, Krista Swanson
Department of Agricultural and Consumer Economics
Three of the last four farm bills (2002, 2014, and 2018) have authorized an update option for the yield used to determine payments by the price support program. Each updated yield was calculated using a 4 or 5 year historical window (1998-2001, 2008-2012, and 2013-2017). Use of a small window amplifies the negative impact of yield-reducing weather events on the updated yield. This issue was clearly a factor in the House of Representatives’ farm bill. It authorized a yield update for farms located in a county in which the US Drought Monitor reported a D4 (exceptional drought) in any area of the county for 20 or more consecutive weeks during the 2008 through 2012 calendar years (farmdoc daily,
October 2, 2018). The enacted 2018 farm bill contains a different update provision, but analysis of yields from the Illinois Farm Business Farm Management (FBFM) program finds strong evidence that the enacted update disproportionately increases Price Loss Coverage (PLC) payment yields impacted by the 2012 drought. However, the analysis finds the 2018 farm bill update does not address an issue tied to rotations. An option that addresses both issues, a 10-year update window, is examined.
Why Rotation Is an Issue
A 2-crop rotation, such as corn-soybeans (likely the most common rotation), means a 5-year update window has 2 years of one crop and 3 years of the other crop. A 3-crop rotation, which likely is not a trivial practice, results in a 5-year window having 2 crops with 2 years and 1 crop with 1 year. Fewer observations magnifies the impact of either poor or good production factors, such as drought. Moreover, farmers with large operations usually farm over a number of separate locations. To minimize “production transaction costs,” such as travel time and wear and tear when moving machinery, they often plant a single crop in one location. Interacting with these considerations is that farmland owners outnumber farmers. In its summary of the sign up for the 2014 farm bill, the US Department of Agriculture, Farm Service Agency (FSA) reports 1.36 million FSA farms with corn base acres and 1.06 million FSA farms with soybean base acres. In contrast, the 2012 Census of Agriculture reports 0.36 million farms with corn and 0.30 million farms with soybeans. FSA farms outnumber census farms by 1.0 million for corn and 0.76 million for soybeans. To summarize, given a 5-year update window, it is likely that a large number of FSA farms have far fewer than 5 years of yield observations for an individual crop, which in turn magnifies the impact of poor and good crop production years in determining PLC program yield.
2018 Farm Bill Yield Update
Owners of farms with base acres for covered commodities are given a 1-time opportunity to update PLC program yields used in determining payments by PLC. The following formula for updating yields is specified in the 2018 farm bill.
(90% times average 2013-2017 yield of a covered commodity on a FSA farm)
times
(average US 2008-2012 yield of a covered commodity divided by its average US 2013-2017 yield)
Yields are per planted acre. The US yield ratio factor (2nd term in the formula) cannot be less than 0.90 nor more than 1.00. Using National Agricultural Statistics Service data, the US yield ratio factor is 0.87 for corn and 0.86 for soybeans. While the US yield ratio factor calculated by FSA will differ from these two values, it is likely the US yield ratio factor for corn and soybeans will be 0.90.
The US yield ratio factor deflates 2013-2017 average yield to a 2008-2012 base. If other factors are the same, the update formula implies an FSA farm will benefit from the update if its average yield increased more than US average yield from 2008-2012 to 2013-2017.
Rationally, an owner will choose the updated yield only if it exceeds existing program yield. Hence, the update decision is effectively, higher of current PLC base yield and 2018 update base yield. This choice was similar in all previous updates, including 2014. The 2014 yield update formula was:
(90% times average 2008-2012 yield per planted acre of a covered commodity on a FSA farm)
Analysis I
Corn yields were compiled for FBFM farms with corn yields for all 10 years from 2008 through 2017. The same data rule was used for soybeans. The resulting corn and soybean data sets contain 805 and 757 farms, respectively. Three combinations of years were examined: all years (2008-2017), every other year starting with 2008 (2008, 2010, 2012, 2014, and 2016), and every other year starting with 2009 (2009, 2011, 2013, 2015, and 2017). The first combination corresponds to continuous corn or soybeans. The second and third combinations correspond to the two different versions of a 50-50 corn-soybean rotation. The 2018 yield update option is applied to the 2013-2017 period while the 2014 farm bill update option is applied to the 2008-2012 period. Because the US yield ratio factor ties together the 2018 and 2014 yield update periods, the analysis sets the 2018 yield update as the higher of the 2014 or 2018 yield updates. The different combinations of years allow the potential impact of rotations on the yield update to be examined.
Note, the analysis focuses on the core update formula, not the decision to update PLC base yield. The analysis does not consider the PLC base yield at the time of the update option. Nor does it consider that, in the 2014 and 2018 yield updates, an FSA farm’s yield for a given year could be no less than 75% of the average county yield for 2008-2012 and 2013-2017, respectively.
2018 vs. 2014 Farm Bill Update Formula
The 2014 farm bill update formula created a clear division across the 3 rotations, especially for Illinois corn. Update yield for the 50-50 rotation with no corn in 2012 was 10% or 14.4 bushel/acre higher than the update yield for the 50-50 rotation with corn in 2012 (see Figure 1). The division for soybeans was much smaller: 2% or 1.1 bushel/acre (see Figure 2). These divisions underscore why the occurrence of droughts in the 2014 farm bill yield update period sparked a desire for a follow-up update in the 2018 farm bill.
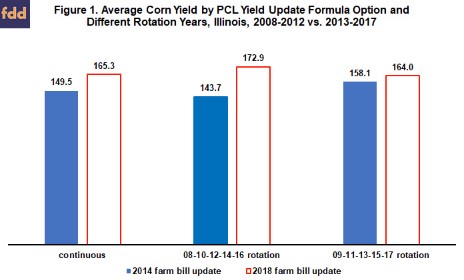
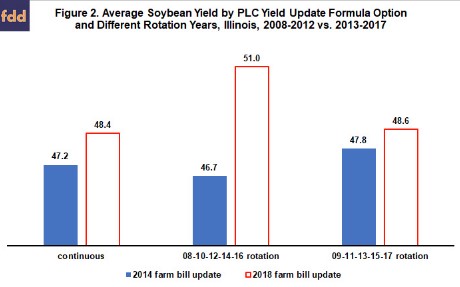
Compared with the 2014 farm bill formula, the 2018 farm bill formula increases the corn update yield by 29.2 and 15.8 bushels/per acre, respectively, for the 50-50 rotation with 2012 corn and continuous corn (see Figure 1). The comparable increases for soybeans are 4.3 and 1.2 bushels/acre (see Figure 2). Updated yields increased only 5.9 (0.8) bushels/acre for the 50-50 rotation without corn (soybeans) in 2012. The 2018 yield update formula thus does disproportionately increase core PLC update yields negatively impacted by the 2012 drought. In contrast, the definition of drought used by the House farm bill to trigger yield updates would not have permitted an update in the Midwest for the 2012 drought in most situations (farmdoc daily,
October 2, 2018).
At the individual farm observation level, over 90% of observations with 2012 in the corn rotation had a higher corn update yield after applying the 2018 farm bill update (see Figure 3). Fifty-three percent had a higher 2018 farm bill update yield If 2012 was not in the corn rotation. For farms with a higher update yield, average increase in update yield ranged from 24% if 2012 was in the 50-50 rotation to 8% if 2012 was not in the 50-50 rotation. A similar pattern exists for soybeans, but the share with a higher formula yield update and the increase in update yield are smaller (see Figure 4).
Rotation Inequity
With the 2018 farm bill yield update, the 50-50 rotation with corn in 2012 has an 8.9 bushel/acre advantage over the 50-50 rotation without corn in 2012 (see Figure 1). The advantage for soybeans is 2.5 bushels/acre (see Figure 2). Moreover, while the 2018 farm bill update reduces the difference between the two 50-50 rotations for corn (from 14.1 to 8.9 bushels/acre), it increases the difference for soybeans (from 1.1 to 2.5 bushels/acre). The 2018 farm bill update formula thus rearranges the equity issue tied to rotations.
Analysis II
To provide additional perspective on the 2014 and 2018 yield update formulas, the difference that result for these two updates across the 3 rotations for a given farm observation is examined. To illustrate this analysis, assume the 2014 farm bill update formula generates update yields of 114, 95, and 141 bushels/acre, respectively, for continuous corn, 50-50 rotation with 2008 as corn’s first year, and 50-50 rotation with 2009 as corn’s first year. The largest difference between two rotations is 46 bushels/acre (141 – 95). Also assume the 2018 farm bill update formulate generates update yields for the farm of 148, 153, and 144 bushels/acre, respectively. The biggest difference is 9 bushels/acre (153-144), again involving the two 50-50 rotations. The 2018 farm bill update formula is thus more fair for this farm than the 2014 farm bill update formula in the sense that update yield is more similar across possible rotations.
A 3rd update option, a 10 year window of 2008-2017, is examined. This option reflects the classic statistical response of adding more observations to dampen variation. With a 10 year update window, both crops in a 50-50 rotation have 5 years of yield in their update calculation instead of 3 or 2 years.
Consistent with Analysis I, the 2018 farm bill yield update formula on average generates a more similar yield than the 2014 farm bill yield update formula across the 3 rotations for corn but not for soybeans (see Figure 5). However, for both crops, the 10 year update window generates the most similar yields across the 3 rotations.
Summary Observations
- Three of the last 4 farm bills, including the 2018 farm bill, have contained an option to update the yield used to calculate price support program payments.
- The preceding suggests yield updates are emerging as a regular farm bill feature.
- Each yield update was calculated using a 4 or 5 year historical window.
- A 4 or 5 year window means any yield-reducing event can materially lower the updated yield.
- Because yield-reducing events, notably droughts, occurred during the 2014 farm bill update window of 2008-2012, it should not be a surprise the 2018 farm bill includes a follow-up update.
- Analysis of Illinois corn and soybean yields finds that the 2018 farm bill yield update formula does disproportionately increase PLC payment yields impacted by the 2012 drought.
- The analysis finds the 2018 farm bill update formula does not address a fairness issue tied to crop rotation. In essence it only shifts which rotation experiences the inequity.
- Crop rotation magnifies the impact of both yield-increasing and yield-reducing events on the yield update by reducing the number of years a given crop is grown in the update window and by sampling the type of yield year.
- Analysis of Illinois corn and soybean yields suggests that update yields are more similar across rotations for a 10 year update window of 2008-2017 than for the 2018 yield update formula.
- Whether the 10 year update window is the best option for mitigating inequities in yield updating is an open question. For example, a trend-adjustment method may be better.
- But, with the frequency of yield updates increasing, a policy issue for the next farm bill is what update formula produces the least inequity in yield update for a farm given the vagaries of weather in combination with rotations as a common farm management practice.
Source:farmdocdaily