By Jonathan Coppess and Gary Schnitkey et.al
Department of Agricultural and Consumer Economics
University of Illinois
Carl Zulauf
Department of Agricultural, Environmental and Development Economics
Ohio State University
Last week the Congressional Budget Office released its ten-year estimates for the mandatory farm bill programs for Commodities (Title I), Conservation (Title II), the Supplemental Nutrition Assistance Program (SNAP, Title IV) and Crop Insurance (CBO May 2022). The Agricultural Improvement Act of 2018 is scheduled to expire with the 2023 calendar, crop and fiscal years, and Congress is taking the initial steps towards reauthorization. While the current baseline has no impact on the reauthorization process scheduled for next year, it does provide updated insights on the major farm bill programs. This article takes an initial look at the latest projections from CBO.
Background
In general, federal budget law requires the Congressional Budget Office (CBO) to provide annual baseline estimates of mandatory spending programs for 10 years; estimates are made under the presumption that there are no changes to the law during that period. For the farm bill, the programs are authorized through 2023 and CBO presumes for baseline purposes that the programs as they are authorized in 2023 will continue for the next 10 years without changes. The baseline is a critical component to a farm bill’s reauthorization because budget law also requires that the ag committees not spend above their baseline when they reauthorize. This creates a zero-sum game under the baseline—increases in spending for any program or title must be accompanied by decreases in other programs or titles—and it drastically complicates the politics and debate for reauthorization. For the 2023 reauthorization, the baseline estimates CBO produces in 2023 will apply to the effort. One final note for the baseline, the main commodities programs in Title I—Agriculture Risk Coverage (ARC) and Price Loss Coverage (PLC)—are subject to a timing shift. ARC and PLC use marketing year average (MYA) prices which are calculated for the 12 months of the marketing year after harvest of the crop begins. This pushes payments for a crop year into the year after the crop was harvested. The statute, moreover, includes a provision that payments are made after October 1, which is the beginning of the federal fiscal year. The end result is that an ARC or PLC payment for the 2022 crop year will be scored in fiscal year 2024 in the baseline (see e.g., farmdoc daily, November 29, 2018; April 18, 2019; July 18, 2019; February 13, 2020).
Discussion
Figure 1 provides the total outlays by fiscal year (FY) projected by CBO through FY2032. From the topline, CBO is projecting decreased outlays beginning in FY2024. For example, CBO projects total spending in FY2024 that is $31.5 billion below FY2023 and almost $53 billion below FY2022.
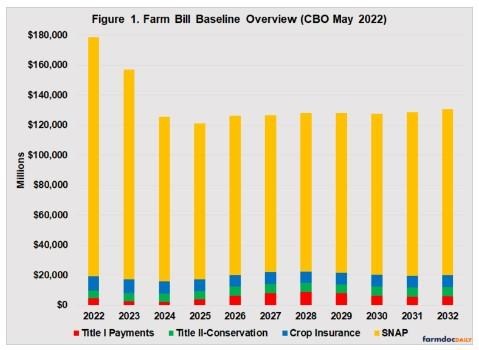
Figure 2 breaks down spending by program and fiscal year for the Commodities Title. Higher expected crop prices are resulting in much lower expected spending for the Agriculture Risk Coverage, county option (ARC-CO) and Price Loss Coverage (PLC) programs in Figure 2. The lowest levels are estimated for FY2023 and FY2024, which correspond to crop years 2021 and 2022. Combined ARC-CO and Agriculture Risk Coverage, Individual Coverage (ARC-IC) do not keep pace with Price Loss Coverage (PLC) in terms of spending.
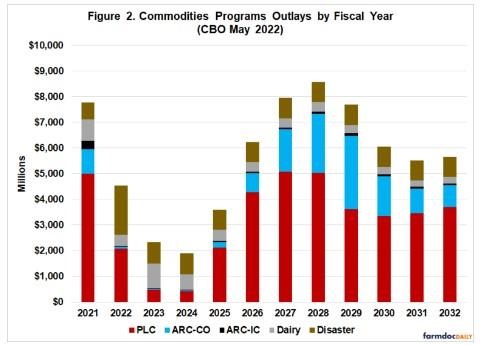
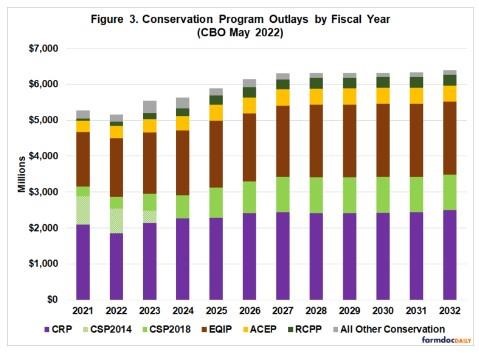
Figure 3 illustrates the outlays by fiscal year for each of the conservation programs in Title II. Overall, CBO projects conservation programs to continue their steady growth, going from just over $5 billion in FY2022 and increasing to nearly $6.3 billion by FY2032. The Conservation Reserve Program (CRP) remains the largest program in terms of outlays, averaging $2.4 billion per fiscal year from FY2023 to FY2032; CRP accounts for just under 40 percent of the conservation baseline. The Environmental Quality Incentives Program (EQIP) is the second largest, averaging just under $2 billion in outlays per fiscal year from FY2023 to FY2032. EQIP accounts for approximately 32 percent of the total conservation baseline. Spending on the Conservation Stewardship Program (CSP) drops noticeably in FY2023 and FY2024 as the program finishes its transition from the 2014 Farm Bill as revised by the 2018 Farm Bill.
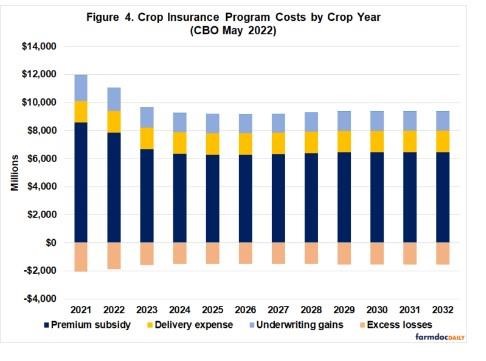
Spending on crop insurance in Figure 4 also decreases noticeably. Outlays in FY2024 are more than a billion dollars below outlays in FY2023. Looking at the costs per crop year, CBO is projecting that premium subsidy costs decrease by $1.2 billion from crop year 2022 to crop year 2023. This is close to the reduction in the fiscal year estimates.
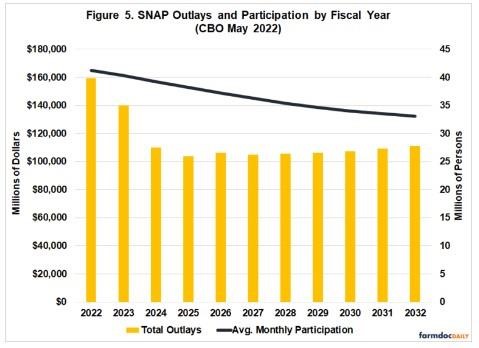
Finally, the Supplemental Nutrition Assistance Program (SNAP) in Title IV remains the largest spending item among the major mandatory farm bill programs, accounting for just under 85 percent of total outlays from FY2023 through FY2032. Total outlays for SNAP drop off significantly after FY2024 when the Covid-19 pandemic assistance expires. For example, spending FY2024 is almost $50 billion below the spending in FY2022 and $30 billion below spending in FY2023. In addition, CBO also estimates a reduction in the average monthly participation from 41.2 million persons in FY2022 to 33.1 million persons in FY2032.
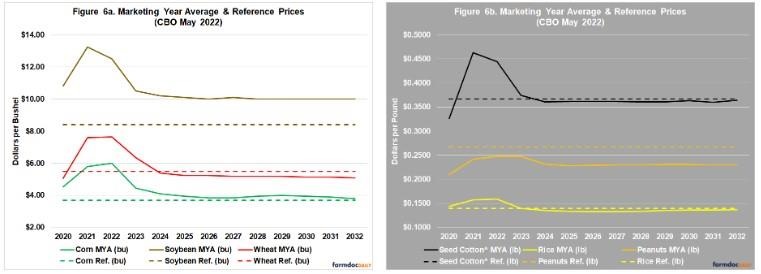
For additional perspective on the spending, a closer look at PLC; the major program crops are corn, soybeans, wheat, all rice (including long grain, medium-short grain and japonica), peanuts, and “seed cotton” (designed for the program in the 2018 Farm Bill by combining cotton lint and cotton seed). The national average crop prices received by farmers during the marketing year (Marketing Year Average, MYA) are the biggest driver of payments and, therefore, of program spending. Figures 6a and 6b compare the MYA prices for each of the major program crops to reference prices; where the MYA is below the reference price, PLC triggers a deficiency payment on the difference (multiplied by program yields and 85% of base acres). For example, MYA for soybeans is forecasted to be above the reference price in every year and would not be expected to trigger any PLC payments. By comparison, MYA for peanuts is projected below the reference price every year and is expected to trigger PLC payments every year.
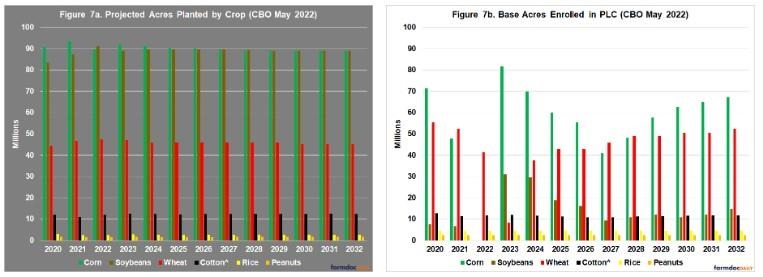
In addition to MYA and reference prices, the acres in the program are also a substantial driver of the outlays for the crops and the payments to the farmer; acres in the program (i.e., base acres) are not the same as acres planted to the crop. Figure 7a illustrates CBO’s projections for total acres planted to each of the major crops, with corn and soybeans each around 90 million acres. Figure 7b illustrates CBO’s projects for the number of base acres of each crop that will be enrolled in PLC each year. From Figures 7a and 7b it is possible to compare the base acres enrolled in PLC to the projected acres planted to the crop. On average during these years, CBO projects that corn base acres enrolled in PLC will be 62 percent of acres planted to corn, while rice base enrolled in PLC averages 168 percent of projected acres planted and peanut base averages 150 percent of projected acres planted.
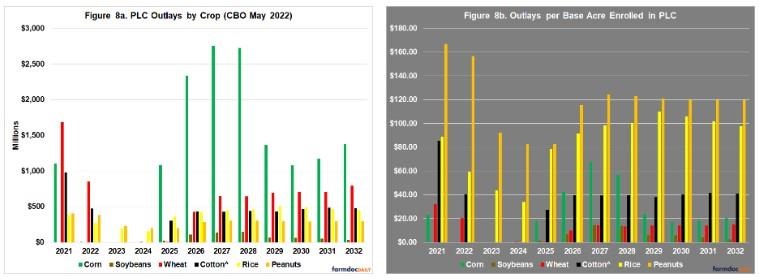
Using the total projected outlays for PLC and CBO’s estimates for base acres enrolled in the program can provide further perspective. Figure 8a illustrates CBO’s projections for PLC outlays by crop and fiscal year. In most years, corn base will receive the most in total PLC payments. However, when compared per base acre enrolled in the program, the view of PLC is much different. In terms of outlays per enrolled base acre, peanuts and rice receive the greater benefits from the program. On average in these years, peanuts will get more than $118 of outlays per base acre enrolled (and a high of $167), rice more than $84 of outlays per base acre enrolled (with a high of nearly $110).
Concluding Thoughts
CBO baselines provide useful information about the mandatory programs in the farm bill and, in the year of reauthorization, the CBO baseline is one of the most important drivers of the debate. CBO’s May 2022 indicates expectations for decreases in spending for SNAP and some initial decreases in ARC and PLC programs due to expected high prices. Lower prices in the outyears appears to drive estimates that crop insurance outlays will reduce. Conservation programs are expected to continue incremental increases. Finally, a closer look at the PLC projections illustrates vast disparities in that program’s operation amongst the major program crops.
Source : illinois.edu