By Carl Zulauf
Department of Agricultural, Environmental and Development Economics
Ohio State University
Ben Brown
College of Agriculture, Food and Natural Resources
University of Missouri
David Orden
Department of Agricultural and Applied Economics
Virginia Tech
Gary Schnitkey and Krista Swanson et.al
Department of Agricultural and Consumer Economics
University of Illinois
Export restraints, including taxes and embargos, are a food security risk for importers. Diversification of sources is one way to manage the risk. Since the early 1990s, a marked decline in the US share of world corn, soybean, and wheat exports has been accompanied by a diversification of corn and wheat export sources but little diversification of soybean export sources.
Background of Analysis: The 1996 Farm Bill eliminated annual land set asides. With a few exceptions, US farmers could plant whatever they desired. They likely chose the most profitable option, including planting no crop. Given this major policy change and the US role in world corn, soybean, and wheat trade; export shares are calculated for the 5 years (1991-1995) preceding this policy change and the last 5 years (2016-2020). Countries included in the study had a 1% share of world exports in one or both periods. Data are from the Production, Supply, and Distribution data base (US Department of Agriculture, Foreign Agriculture Service).
Corn: The US has remained the world’s largest corn exporter, but its share declined from 71% to 34% (see Figure 1). China was the world’s 2nd largest corn exporter but now is an importer, and South Africa’s role has declined. On the other hand, Brazil, Ukraine, Russia, the European Union (EU), and Paraguay have emerged as exporters, with Brazil and Ukraine attaining double digit world shares.
Soybeans: The most notable change is Brazil displacing the US as the world’s leading soybean exporter (see Figure 2). Combined Brazil-US export share changed relatively little, increasing slightly from 82% to 85%. Argentina remained the 3rd largest exporter but Paraguay is now pushing it.
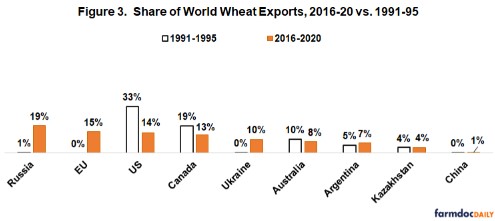
Wheat: Like corn, a major realignment occurred in world wheat export sources. Core shift was from North American to Europe. Combined US-Canada share declined from 52% in 1991-1995 to 27% currently. Combined Russia-EU-Ukraine share went from 1% to 44%.
Concentration Index: Market concentration has long been a topic of interest to economists. A rich literature has emerged, including various metrics to measure it. A widely used metric is the Herfindahl-Hirschman Index (HHI) (see Date Note). HHI is calculated for each year. A country’s share of world corn, soybean, and wheat exports is the unit of observation. HHI is indexed to its 1991 value, making its 1991 value 100%. An increase / decrease in HHI indicates an increase / decrease in concentration.
HHI is lower now than in the early 1990s for all 3 crops (see Figure 4). The decline was largest for corn, then wheat, then soybeans. HHI for corn and wheat has stabilized since 2010 after declining sharply for corn since 1994, with an especially sharp decline over 2007-2011. The latter coincides with the large expansion in US corn going into ethanol production. For wheat, HHI declined at a slower, more consistent rate than for corn. For soybeans, HHI declined over 1995-2010 as US and Brazil export shares converged. It has since risen as Brazil’s share of world soybean exports has grown increasingly larger than the US share. Both number of exporters and their shares are important to understanding concentration, but, depending on the question, one may be of more interest.
Concluding Observations
Since the early 1990s, sources of world corn and wheat exports have diversified as other countries filled the declining US share. As a result, concentration has declined in world corn and wheat exports.
Sources of world soybean exports diversified only slightly. Concentration declined early in this period as the US share declined but has increased in recent years as Brazil’s dominance over the US has grown. If Brazil and the US are treated as one unit, concentration increased somewhat as their combined share of world soybean exports grew slightly to 85%.
Export restrictions are a serious food security risk for importers. Export restrictions include taxes on exports and partial or total embargos. They may be driven by high domestic prices / low domestic supply or by geopolitical agendas. At the time this article was written, Russia was considering a potential tax on wheat and corn exports due to high domestic prices. For the same reason, Argentina had a cap on daily exports of corn and Ukraine had a cap on total corn exports through June 30, 2021.
Current World Trade Organization (WTO) rules for international trade do not address export embargos or export taxes. Discussions have occurred since the food price inflation associated with the 2007-2013 period of crop prosperity but little action has been taken. However, recently 79 WTO members including the US committed not to impose export restrictions on purchases for humanitarian purposes by the World Food Programme. WTO members have not been willing to commit to rules that would be a broader deterrent. Instead, maintaining flexibility to address domestic concerns has outweighed willingness to make international commitment in these situations. Several important agricultural exporters, Argentina, Russia and South Africa, are not among the 79 countries, while Australia, the EU, Paraguay, Ukraine, and Uruguay are among the signatories.
Diversification of sources is one way to minimize the risk of export restrictions, although not to completely avoid effects of such restrictions causing higher world prices. Changes in world corn and wheat trade over the past 30 years has likely reduced this risk. The evidence is mixed for soybeans.
Many countries subsidize production of farm commodities for domestic food security reasons. Export restrictions run the risk of leading food importers to select certain crops to subsidize. They may consider concentration and diversification trends in corn, soybean, and wheat export sources when deciding on their support policies. Export restrictions can thus prove detrimental to exporters over time.
A factor that likely impacts a country’s probability of imposing export restrictions is the share of income spent on food. According to data reported by the US Department of Agriculture, Economic Research Service for 2013, share of income spent on food consumed at home by the US, Brazil, Russia, and Ukraine was 6.8%, 15.7%, 26.4%, and 38.1%, respectively.
The US has imposed export embargos for domestic supply and geopolitical reasons (farmdoc daily
July 13, 2018), but it has become reluctant to use export restrictions on farm products. The US Constitution prohibits export taxes. However, future export restrictions cannot be ruled out. For example, it is not clear how high prices would have to be at present, but history suggests there are prices at which the US would restrict exports of farm products for domestic reasons.